Mid Cap Discovery Fund
Mid Cap Discovery Fund
Quick Facts
| Investor | Institutional | |
| Ticker: | BUFTX | BUITX |
| Daily Pricing: | ||
| As of 5/8/2025 | ||
| NAV: | $22.48 | $22.72 |
| $ Change: | $0.18 | $0.17 |
| % Change: |
0.81% | 0.75% |
| YTD: |
-2.73% | -2.70% |
| Inception Date: | 4/16/2001 | 7/1/2019 |
| Expense Ratio: | 1.01% | 0.87% |
| Total Net Assets: | $572.17 Million (3/31/25) | |
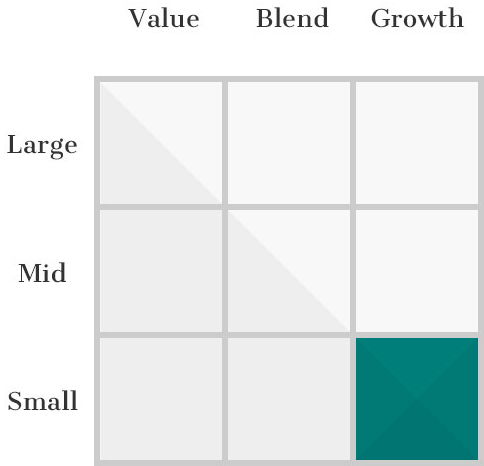
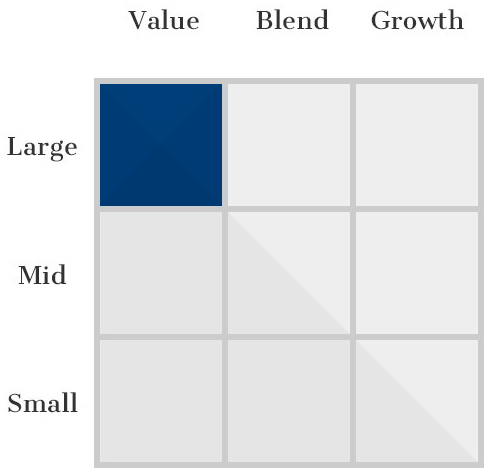
| Morningstar Category: | Mid Cap Growth | |
| Benchmark Index: | Russell Midcap Growth | |
|
Related Material: Fund Fact Sheet Q1 2025 PM Commentary Q1 2025 Portfolio Manager Q&A |
||
FUND OBJECTIVE & INVESTMENT PHILOSOPHY
The investment objective of the Buffalo Mid Cap Discovery Fund is long-term growth of capital.
The Fund managers seek to identify companies expected to benefit from innovation and experience growth based on the identification of long-term, measurable secular trends, and which, as a result, the managers believe may have potential revenue growth in excess of the gross domestic product growth rate.
Companies engaged in innovative strategies are those who, in the Fund managers’ opinion, are engaged in the pursuit and practical application of knowledge to discover, develop, and commercialize products, services, or intellectual property.
Companies are screened using in-depth, in-house research to identify those which the Fund managers believe have favorable attributes, including attractive valuation, strong management, conservative debt, free cash flow, scalable business models, and competitive advantages.
To us, innovation means to discover and transform new ideas into meaningful commercial value. The greater the economic impact and the longer the staying power, the better.
We seek under-appreciated stock opportunities in companies where thoughtful management teams are in a favorable position to use innovation for market advantage and sustained shareholder value creation.
Dave Carlsen, CFA, Portfolio Manager
Morningstar Ratings


Overall Morningstar Rating™ of BUFTX based on risk-adjusted returns among 481 Midcap Growth funds as of 3/31/25.
Performance (%)
| As of 3/31/25 | 3 MO | YTD | 1 YR | 3 YR | 5 YR | 10 YR | 15 YR | 20 YR | Since Inception |
|---|---|---|---|---|---|---|---|---|---|
| BUFFALO MID CAP DISCOVERY FUND - Investor | -5.97 | -5.97 | -6.73 | 0.12 | 9.91 | 7.74 | 10.72 | 10.01 | 8.61 |
| BUFFALO MID CAP DISCOVERY FUND - Institutional | -5.91 | -5.91 | -6.59 | 0.27 | 10.07 | 7.90 | 10.89 | 10.17 | 8.77 |
| Russell Midcap Growth Index | -7.12 | -7.12 | 3.57 | 6.16 | 14.86 | 10.14 | 12.20 | 10.16 | 9.29 |
| 2013 | 2014 | 2015 | 2016 | 2017 | 2018 | 2019 | 2020 | 2021 | 2022 | 2023 | 2024 | |
|---|---|---|---|---|---|---|---|---|---|---|---|---|
| BUFFALO MID CAP DISCOVERY FUND - Investor | 36.61 | 10.68 | 5.64 | 5.56 | 25.44 | -6.54 | 31.63 | 33.81 | 11.90 | -28.67 | 24.30 | 5.44 |
| BUFFALO MID CAP DISCOVERY FUND - Institutional | 36.82 | 10.85 | 5.80 | 5.72 | 25.62 | -6.40 | 31.82 | 34.03 | 12.07 | -28.57 | 24.50 | 5.56 |
| Russell Midcap Growth Index | 35.74 | 11.90 | -0.20 | 7.33 | 25.27 | -4.75 | 35.47 | 35.59 | 12.73 | -26.72 | 25.87 | 22.10 |
3 Year Risk Metrics
| BUFTX vs Russell Midcap Growth Index (As of 3/31/25) | |
|---|---|
| Upside Capture | 81.86 |
| Downside Capture | 103.82 |
| Alpha | -5.41 |
| Beta | 0.95 |
| Sharpe Ratio | -0.20 |
Hypothetical Growth of $10,000
This chart illustrates the performance of a hypothetical $10,000 investment made in the Fund on the Inception Date. Assumes reinvestment of dividends and capital gains. This chart does not imply future performance.
Portfolio
Portfolio Characteristics
| (As of 3/31/25) | |
|---|---|
| # of Holdings | 68 |
| Median Market Cap | $25.44 B |
| Weighted Average Market Cap | $30.18 B |
| 3-Yr Annualized Turnover Ratio | 33.75% |
| % of Holdings with Free Cash Flow | 94.03% |
| Active Share | 78.86% |
Top 10 Holdings
| Holding | Ticker | Sector | % of Net Assets |
|---|---|---|---|
| MSCI, Inc. | MSCI | Financials | 4.25 |
| TransUnion | TRU | Industrials | 3.31 |
| AMETEK, Inc. | AME | Industrials | 2.63 |
| Veeva Systems, Inc. | VEEV | Health Care | 2.24 |
| CoStar Group, Inc. | CSGP | Industrials | 2.16 |
| Verisk Analytics, Inc. | VRSK | Industrials | 2.11 |
| Copart, Inc. | CPRT | Industrials | 2.07 |
| Shift4 Payments, Inc. | FOUR | Financials | 1.99 |
| Pinterest, Inc. | PINS | Consumer Discretionary | 1.92 |
| CyberArk Software, Ltd. | CYBR | Information Technology | 1.89 |
| TOP 10 HOLDINGS TOTAL | 24.56% | ||
Sector Weighting
As of 3/31/25. Security weightings are subject to change and are not recommendations to buy or sell any securities. Sector Allocation may not equal 100% due to rounding.
Market Capitalization
As of 3/31/25. Market Cap percentages may not equal 100% due to rounding.
Management


Commentary
Literature
| Buffalo Mid Cap Discovery Fund Documents | Last Updated |
|---|---|
| Fact Sheet | 3/31/25 |
| Quarterly Commentary | 3/31/25 |
| Full Fund Holdings | 12/31/24 |
| Prospectus | 7/29/24 |
| Statement of Additional Information | 7/29/24 |
| Annual Report | 3/31/24 |
| Semi-Annual Report | 9/30/23 |
| Tax Guide - 2023 | 1/8/24 |
Fundamental Approach
We get to know the companies we invest in and learn how they run their business.
Top-Down & Bottom-Up
We identify Top-Down broad, secular growth trends and search for companies from the Bottom-Up.
Proprietary Philosophy
We construct our portfolios based on our own proprietary investment strategy.
Disciplined Investing
Sticking to our disciplined investment strategy ensures we maintain a consistent, balanced approach.
Morningstar Rating™
The Morningstar Rating™ for funds, or "star rating", is calculated for managed products (including mutual funds, variable annuity and variable life subaccounts, exchange-traded funds, closed-end funds, and separate accounts) with at least a three-year history. Exchange-traded funds and open-ended mutual funds are considered a single population for comparative purposes. It is calculated based on a Morningstar Risk-Adjusted Return measure that accounts for variation in a managed product's monthly excess performance, placing more emphasis on downward variations and rewarding consistent performance. The Morningstar Rating does not include any adjustment for sales loads. The top 10% of products in each product category receive 5 stars, the next 22.5% receive 4 stars, the next 35% receive 3 stars, the next 22.5% receive 2 stars, and the bottom 10% receive 1 star. The Overall Morningstar Rating™ for a managed product is derived from a weighted average of the performance figures associated with its three-, five-, and 10-year (if applicable) Morningstar Rating™ metrics. The weights are: 100% three-year rating for 36-59 months of total returns, 60% five-year rating/40% three-year rating for 60-119 months of total returns, and 50% 10-year rating/30% five-year rating/20% three-year rating for 120 or more months of total returns. While the 10-year overall star rating formula seems to give the most weight to the 10-year period, the most recent three-year period actually has the greatest impact because it is included in all three rating periods.
©2024 Morningstar, Inc. All Rights Reserved. The information contained herein: (1) is proprietary to Morningstar; (2) may not be copied or distributed; and (3) is not warranted to be accurate, complete or timely. Neither Morningstar nor its content providers are responsible for any damages or losses arising from any use of this information. Past performance is no guarantee of future results.
The Buffalo Mid Cap Discovery Fund (BUFTX) received 3 stars among 481 for the 3-year, 2 stars among 447 for the 5-year, and 3 stars among 358 Mid-Cap Growth funds for the 10-year period ending 3/31/25. Other share classes may have different performance characteristics.