


Total Assets $490.02 Million (3/31/22)
Expense Ratio 1.01% / 0.86%
Benchmark Morningstar Moderately Aggressive Target Risk

Dividend Focus Fund
Dividend Focus Fund
Quick Facts
| Investor | Institutional | |
| Ticker: | BUFDX | BUIDX |
| Daily Pricing: | ||
| As of 4/22/2024 | ||
| NAV: | $29.04 | $29.05 |
| $ Change: | $0.22 | $0.21 |
| % Change: |
0.76% | 0.73% |
| YTD: |
6.26% | 6.33% |
| Inception Date: | 12/3/2012 | 7/1/2019 |
| Expense Ratio: | 0.95% | 0.80% |
| Total Net Assets: | $164.56 Million (3/31/24) | |
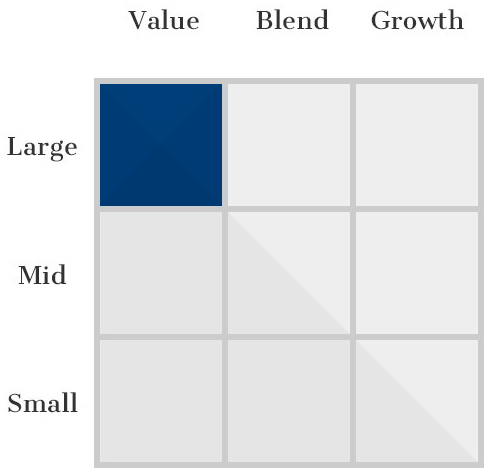
| Morningstar Category: | Large Cap Blend | |
| Benchmark Index: | Russell 1000 | |
| Dividend Distribution: | Quarterly | |
|
Related Material: Fund Fact Sheet Q1 2024 PM Commentary Q4 2023 Portfolio Manager Q&A |
||
FUND OBJECTIVE & INVESTMENT PROCESS
The investment objective of the Buffalo Dividend Focus Fund is primarily current income, with long-term growth of capital as a secondary objective.
To pursue its investment objective, the Fund invests in dividend-paying equity securities, consisting of domestic common stocks, preferred stocks, and convertible securities. During normal market conditions, at least 80% of the Fund’s assets will be invested in dividend-paying equity securities, companies that declare and pay cash dividends on at least an annual basis.
While the Fund may invest in securities of companies of any size, the Fund managers expect the majority of common stocks purchased will be of large-cap companies, those with market capitalizations in excess of $10 billion at the time of initial purchase.
We are focused on buying dividend-paying companies that can have sustainable competitive advantages, generate strong return on capital and free cash flow, have conservative balance sheets, and have great management teams.
We seek to buy these companies at reasonable valuations and believe that holding them for the long-term will generate favorable risk adjusted returns.
Paul Dlugosch, Portfolio Manager
CFRA Research and Dividend.com recently hosted a webinar with the topic “Dividend Funds: Do we even need bonds?“. Buffalo Dividend Focus Fund co-portfolio manager Jeff Deardorff, CFA, was a featured presenter on the panel.
To learn more about what was discussed during the webinar and to access a free replay, click here.
Morningstar Rating


Overall Morningstar Rating™ of BUFDX based on risk-adjusted returns among 1,293 Large Blend funds as of 3/31/24.
Performance (%)
| As of 3/31/24 | 3 MO | YTD | 1 YR | 3 YR | 5 YR | 10 YR | Since Inception |
|---|---|---|---|---|---|---|---|
| BUFFALO DIVIDEND FOCUS FUND - Investor | 9.92 | 9.92 | 27.31 | 11.41 | 14.36 | 12.27 | 13.24 |
| BUFFALO DIVIDEND FOCUS FUND - Institutional | 9.96 | 9.96 | 27.47 | 11.56 | 14.53 | 12.43 | 13.41 |
| Russell 1000 Index | 10.30 | 10.30 | 29.87 | 10.45 | 14.76 | 12.68 | 14.31 |
| S&P 500 Index | 10.56 | 10.56 | 29.88 | 11.49 | 15.05 | 12.96 | 14.48 |
| 2013 | 2014 | 2015 | 2016 | 2017 | 2018 | 2019 | 2020 | 2021 | 2022 | |
|---|---|---|---|---|---|---|---|---|---|---|
| BUFFALO DIVIDEND FOCUS FUND - Investor | 23.93 | 20.81 | 0.13 | 12.06 | 18.02 | -5.05 | 27.66 | 16.64 | 20.97 | -8.75 |
| BUFFALO DIVIDEND FOCUS FUND - Institutional | 24.12 | 20.98 | 0.28 | 12.23 | 18.20 | -4.91 | 27.85 | 16.83 | 21.15 | -8.62 |
| Russell 1000 Index | 33.11 | 13.24 | 0.92 | 12.05 | 21.69 | -4.78 | 31.43 | 20.96 | 26.45 | -19.13 |
| Morningstar U.S. Large-Mid Cap Index | 33.20 | 13.32 | 0.92 | 11.59 | 21.71 | -4.52 | 31.61 | 21.11 | 26.44 | -19.50 |
For performance prior to 7/1/19 (Inception Date of Institutional Class), performance of the Investor Class shares is used and includes expenses not applicable and lower than those of Investor Class shares.Performance data quoted represents past performance; past performance does not guarantee future results. The investment return and principal value of an investment will fluctuate so that an investor’s shares, when redeemed, may be worth more or less than their original cost. Current performance of the fund may be lower of higher than the performance quoted and can be obtained here. Performance is annualized for periods greater than 1 year. Each Morningstar category average represents a universe of funds with similar objectives.
3 Year Risk Metrics
| BUFDX vs Russell 1000 Index (As of 3/31/24) | |
|---|---|
| Upside Capture | 77.01 |
| Downside Capture | 78.44 |
| Alpha | 2.77 |
| Beta | 0.79 |
| Sharpe Ratio | 0.61 |
Hypothetical Growth of $10,000
This chart illustrates the performance of a hypothetical $10,000 investment made in the Fund on the Inception Date. Assumes reinvestment of dividends and capital gains. This chart does not imply future performance.
Distributions
2024 Projected Distribution Dates:
Record 6/17/2024 Payable 6/18/2024
Record 9/17/2024 Payable 9/18/2024
Record 12/4/2024 Payable 12/5/2024 Cap Gains (if any)
Record 12/17/2024 Payable 12/18/2024
Record 6/17/2024 Payable 6/18/2024
Record 9/17/2024 Payable 9/18/2024
Record 12/4/2024 Payable 12/5/2024 Cap Gains (if any)
Record 12/17/2024 Payable 12/18/2024
| Record Date | Payable Date | Distribution NAV | Net Investment Income | Short-Term Capital Gains | Long-Term Capital Gains | Distribution Total |
|---|---|---|---|---|---|---|
| 3/18/24 | 3/19/24 | $29.50 (Inv) $29.51 (Inst) | $0.05519288 $0.06513191 | - - | $0.05519288 $0.06513191 |
|
| 12/18/23 | 12/19/23 | $27.20 (Inv) $27.20 (Inst) | $0.15591721 $0.16483955 | - - | $0.15591721 $0.16483955 |
|
| 12/4/23 | 12/5/23 | $26.40 (Inv) $26.41 (Inst) | - - | - - | 0.12045 0.12045 | $0.12045 $0.12045 |
| 9/18/23 | 9/19/23 | $25.69 (Inv) $25.70 (Inst) | $0.05988226 $0.06325017 | - - | - - | $0.05988226 $0.06325017 |
| 6/20/23 | 6/21/23 | $24.99 (Inv) $24.99 (Inst) | $0.13682440 $0.14679972 | - - | - - | $0.13682440 $0.14679972 |
| 3/21/23 | 3/20/23 | $23.12 (Inv) $23.12 (Inst) | $0.05969832 $0.06839440 | - - | - - | $0.05969832 $0.06839440 |
| 12/19/22 | 12/20/22 | $23.08 (Inv) $23.08 (Inst) | $0.05908577 $0.06777300 | - - | - - | $0.05908577 $0.06777300 |
| 12/4/22 | 12/5/22 | $23.89 (Inv) $23.90 (Inst) | - - | - - | $0.38214 $0.38214 | $0.38214 $0.38214 |
| 9/19/22 | 9/20/22 | $23.27 (Inv) $23.27 (Inst) | $0.05162443 $0.06073302 | - - | - - | $0.05162443 $0.06073302 |
| 6/20/22 | 6/21/22 | $22.72 (Inv) $22.72 (Inst) | $0.06141577 $0.06934834 | - - | - - | $0.06141577 $0.06934834 |
| 3/19/22 | 3/18/22 | $25.56 (Inv) $25.56 (Inst) | $0.05379801 $0.06334236 | - - | - - | $0.05379801 $0.06334236 |
| 12/19/21 | 12/20/21 | $25.24 (Inv) $25.24 (Inst) | $0.02757485 $0.03722365 | - - | - - | $0.02757485 $0.03722365 |
| 12/3/21 | $24.99 (Inv) $24.99 (Inst) | - - | $0.10327 $0.10327 | $0.20964 $0.20964 | $0.31291 $0.31291 |
|
| 9/20/21 | $24.79 (Inv) $24.79 (Inst) | $0.03057741 $0.04007525 | - - | - - | $0.03057741 $0.04007525 |
|
| 6/18/21 | $24.27 (Inv) $24.26 (Inst) | $0.02933960 $0.03839857 | - - | - - | $0.02933960 $0.03839857 |
|
| 3/18/21 | $23.16 (Inv) $23.16 (Inst) | $0.05098388 $0.05942821 | - - | - - | $0.05098388 $0.05942821 |
|
| 12/18/20 | $21.72 (Inv) $21.72 (Inst) | $0.00905139 $0.01801390 | - - | - - | $0.00905139 $0.01801390 |
|
| 9/18/20 | $19.13 (Inv) $19.13 (Inst) | $0.03170945 $0.03903915 | - - | - - | $0.03170945 $0.03903915 |
|
| 6/18/20 | $18.26 (Inv) $18.26 (Inst) | $0.03034499 $0.03590278 | - - | - - | $0.03034499 $0.03590278 |
|
| 3/18/20 | $14.07 (Inv) $14.07 (Inst) | $0.03107063 $0.03831320 | - - | - - | $0.03107063 $0.03831320 |
|
| 12/18/19 | $18.82 (Inv) $18.82 (Inst) | $0.04196909 $0.04964262 | - - | - - | $0.04196909 $0.04964262 |
|
| 9/18/19 | $17.80 (Inv) $17.80 (Inst) | $0.04731858 $0.05327159 | - - | - - | $0.04731858 $0.05327159 |
|
| 6/18/19 | $17.20 | $0.06566509 | - | - | $0.06566509 | |
| 3/19/19 | $16.72 | $0.05232873 | - | - | $0.05232873 | |
| 12/18/18 | $15.33 | $0.08791977 | $0.02500 | $0.51339 | $0.62630977 | |
| 9/18/18 | $17.96 | $0.05499230 | - | - | $0.05499230 | |
| 6/19/18 | $16.99 | $0.05791680 | - | - | $0.05791680 | |
| 3/20/18 | $16.72 | $0.04369471 | - | - | $0.04369471 | |
| 12/19/17 | $16.73 | $0.05315489 | $0.15204 | - | $0.20519489 | |
| 9/19/17 | $15.79 | $0.05107348 | - | - | $0.05107348 | |
| 6/20/17 | $15.53 | $0.04405814 | - | - | $0.04405814 | |
| 3/20/17 | $15.37 | $0.04662158 | - | - | $0.04662158 | |
| 12/20/16 | $14.58 | $0.04502534 | $0.06489 | $0.03508 | $0.14499534 | |
| 9/20/16 | $13.78 | $0.04538819 | - | - | $0.04538819 | |
| 6/20/16 | $13.34 | $0.04391608 | - | - | $0.04391608 | |
| 3/18/16 | $13.15 | $0.04845082 | - | - | $0.04845082 | |
| 12/18/15 | $12.88 | $0.04061333 | $0.14263 | $0.11942 | $0.30266333 | |
| 9/18/15 | $12.94 | $0.03816853 | - | - | $0.03816853 | |
| 6/18/15 | $14.29 | $0.04120635 | - | - | $0.04120635 | |
| 3/18/15 | $13.89 | $0.04200730 | - | - | $0.04200730 | |
| 12/18/14 | $13.53 | $0.03066401 | $0.54808 | $0.10086 | $0.67960401 | |
| 9/18/14 | $13.50 | $0.02424009 | - | - | $0.02424009 | |
| 6/18/14 | $13.05 | $0.03496855 | - | - | $0.03496855 | |
| 3/18/14 | $12.11 | $0.03702784 | - | - | $0.03702784 | |
| 12/18/13 | $11.56 | $0.04725764 | $0.38271 | - | $0.42996764 | |
| 9/18/13 | $11.47 | $0.03960545 | - | - | $0.03960545 | |
| 6/18/13 | $11.13 | $0.03967611 | - | - | $0.03967611 | |
| 3/19/13 | $10.36 | $0.01492578 | - | - | $0.01492578 |
Portfolio
Portfolio Characteristics
| (As of 3/31/24) | |
|---|---|
| # of Holdings | 97 |
| Median Market Cap | $70.55 B |
| Weighted Average Market Cap | $511.08 B |
| 3-Yr Annualized Turnover Ratio | 3.84% |
| % of Holdings with Free Cash Flow | 68.24% |
| 30-day SEC Yield | 1.41% |
Top 10 Holdings
| Holding | Ticker / Maturity | Sector | % of Net Assets |
|---|---|---|---|
| Microsoft Corporation | MSFT | Information Technology | 4.92 |
| Apple Inc. | AAPL | Information Technology | 4.20 |
| Meta Platforms Inc. Class A | META | Communication Services | 3.31 |
| Viper Energy, Inc. | VNOM | Energy | 3.30 |
| Visa Inc. Class A | V | Financials | 2.36 |
| S&P Global, Inc. | SPGI | Financials | 2.21 |
| UnitedHealth Group Incorporated | UNH | Health Care | 2.07 |
| Burford Capital Limited | BUR | Financials | 1.98 |
| Royal Caribbean Group 6.0% 15-aug-2025 | Consumer Discretionary | 1.88 | |
| Arthur J. Gallagher & Co. | AJG | Financials | 1.83 |
| TOP 10 HOLDINGS TOTAL | 28.07% | ||
Sector Weighting
As of 3/31/24. Security weightings are subject to change and are not recommendations to buy or sell any securities. Sector Allocation may not equal 100% due to rounding.
Market Capitalization
As of 3/31/24. Market Cap percentages may not equal 100% due to rounding.
Management


Commentary
PERFORMANCE COMMENTARY
(As of 12/31/23) —
The Buffalo Dividend Focus Fund posted a return of 11.14% for the quarter, a result
that underperformed the Russell 1000 Index return of 11.96%. All sectors of the
portfolio made a positive absolute contribution to the fund’s performance, however
sector weightings and security selection compared to the benchmark contributed
to relative underperformance. Exposure to Consumer Staples, Energy, Financials,
Health Care, Materials, Real Estate and Utilities delivered constructive performance
for the quarter, but was offset by Communication Services, Consumer Discretionary,
Industrials, and Information Technology detracted from the relative performance.
Top Contributors
Specific securities that contributed most positively to performance include Microsoft
Corporation (MSFT), Meta Platforms (META), and Apple Inc. (AAPL). Microsoft
advanced on quarterly results that showed strong positioning in cloud and artificial
intelligence (AI) services as well as expanding margins. Meta delivered healthy quarterly
earnings and a favorable cost outlook for AI. While Apple rose as investors overlooked
weak sales in China and instead focused on interest rate cuts with the prospect of a soft
landing for the U.S. economy.
Top Detractors
To the downside, Northern Oil and Gas (NOG), Hess Corp. (HES) and Valero Energy
(VLO) were among the large detractors to fund performance during the period. The
price of oil dropped from $90 per barrel to around $70 which caused the stock price of
energy companies to fall, as their near-term profits are likely to contract.
OUTLOOK
(As of 12/31/23) —
Despite the uncertainty created by interest rate policies, domestic politics, and
geo-political tensions, among other things, we remain focused on wide moat, large
capitalization companies trading at reasonable valuations, in our view. As always, the
fund will continue to emphasize competitively advantaged dividend-paying companies
that can be purchased at a fair value. As stock market volatility spikes, we will look
for opportunities to find companies that fit our investment criteria, as we continue
to follow our process of finding new investment ideas and to be ready when market
declines provide better entry points.
The opinions expressed are those of the Portfolio Manager(s) and are subject to change, are not guaranteed and should not be considered recommendations to buy or sell any security. Earnings growth is not representative of the fund’s future performance.
Literature
| Buffalo Dividend Focus Fund Documents | Last Updated |
|---|---|
| Fact Sheet | 3/31/24 |
| Quarterly Q&A | 12/31/23 |
| Full Fund Holdings | 6/30/23 |
| Prospectus | 7/28/23 |
| Statement of Additional Information | 7/28/23 |
| Annual Report | 3/31/23 |
| Semi-Annual Report | 9/30/22 |
| Tax Guide - 2023 | 1/8/24 |
Fundamental Approach
We get to know the companies we invest in and learn how they run their business.
Top-Down & Bottom-Up
We identify Top-Down broad, secular growth trends and search for companies from the Bottom-Up.
Proprietary Philosophy
We construct our portfolios based on our own proprietary investment strategy.
Disciplined Investing
Sticking to our disciplined investment strategy ensures we maintain a consistent, balanced approach.
The Morningstar Rating™ for funds, or "star rating", is calculated for managed products (including mutual funds, variable annuity and variable life subaccounts, exchange-traded funds, closed-end funds, and separate accounts) with at least a three-year history. Exchange-traded funds and open-ended mutual funds are considered a single population for comparative purposes. It is calculated based on a Morningstar Risk-Adjusted Return measure that accounts for variation in a managed product's monthly excess performance, placing more emphasis on downward variations and rewarding consistent performance. The top 10% of products in each product category receive 5 stars, the next 22.5% receive 4 stars, the next 35% receive 3 stars, the next 22.5% receive 2 stars, and the bottom 10% receive 1 star. The Overall Morningstar Rating™ for a managed product is derived from a weighted average of the performance figures associated with its three-, five-, and 10-year (if applicable) Morningstar Rating™ metrics. The weights are: 100% three-year rating for 36-59 months of total returns, 60% five-year rating/40% three-year rating for 60-119 months of total returns, and 50% 10-year rating/30% five-year rating/20% three-year rating for 120 or more months of total returns. While the 10-year overall star rating formula seems to give the most weight to the 10-year period, the most recent three-year period actually has the greatest impact because it is included in all three rating periods.
The Buffalo Dividend Focus Fund (BUFDX) received 5 stars among 1,293 for the 3-year period, 4 stars among 1,179 for the 5-year period, and 4 stars among 888 Large Blend funds for the 10-year period ending 3/31/24.