Early Stage Growth Fund

Early Stage Growth Fund

Quick Facts
Investor Institutional
Ticker: BUFOX BUIOX
Daily Pricing:  
As of 4/25/2024  
NAV: $15.22 $15.34
$ Change: $-0.15 $-0.15
% Change:
-0.98% -0.97%
YTD:
-1.30% -1.29%
Inception Date: 5/21/2004 7/1/2019
Expense Ratio: 1.50% 1.35%
Total Net Assets: $78.20 Million  (3/31/24)
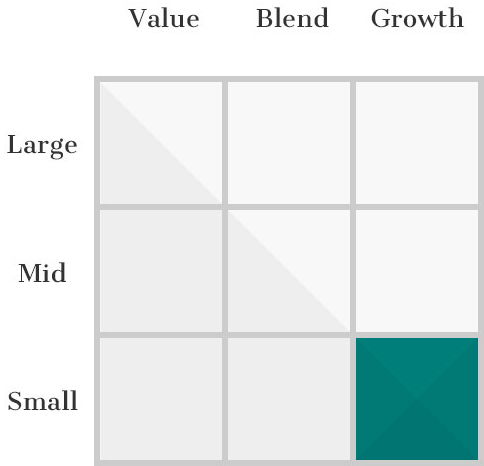
Morningstar Category: Small Cap Growth
Benchmark Index: Russell 2000 Growth
Related Material:
   Fund Fact Sheet Q1 2024
   PM Commentary Q4 2023
Recent Media Coverage
Fund Objective & Investment Process

The investment objective of the Buffalo Early Stage Growth Fund is long-term growth of capital. The Fund invests primarily in equity securities, consisting of common stocks, preferred stocks, convertible securities, warrants and rights, of companies that, at the time of purchase by the Fund, are defined as early stage growth companies. Early stage growth companies are defined by the Fund as companies that, at the time of purchase by the Fund, have market capitalizations below the median of the Russell 2000 Growth Index and are companies that are starting to develop a new product or service or have recently developed a new product or service.

The Fund managers seek to identify companies for the Fund’s portfolio that are expected to experience growth based on the identification of long-term, measurable secular trends, and which, as a result, may have potential revenue growth in excess of the gross domestic product growth rate. Companies are screened using in-depth, in-house research to identify premier early-stage growth companies which generally demonstrate:

  • Strong management teams
  • Little or no debt
  • Potential for increasing free cash flow
  • Scalable business models with a competitive advantage
  • Potential for increasing margins
  • Attractive risk/reward given the market framework
|

We believe investing in an actively-managed portfolio of premier, early-stage, growth companies could lead to growth of capital over time. We look for companies that could benefit from long-term industrial, technological, or general market trends, and are trading at what we view as attractive valuations.

Craig Richard, Portfolio Manager

Morningstar Rating


Overall Morningstar Rating™ of BUFOX based on risk-adjusted returns among 552 Small Growth funds as of 3/31/24.

Investment Style

Performance (%)

As of 3/31/243 MOYTD1 YR3 YR5 YR10 YR15 YRSince Inception
BUFFALO EARLY STAGE GROWTH FUND - Investor4.804.807.38-7.247.797.1915.618.41
BUFFALO EARLY STAGE GROWTH FUND - Institutional4.834.837.45-7.107.947.3415.788.57
  Russell 2000 Growth Index7.587.5820.35-2.687.387.8913.398.84
As of 3/31/243 MOYTD1 YR3 YR5 YR10 YR15 YRSince Inception
BUFFALO EARLY STAGE GROWTH FUND - Investor4.804.807.38-7.247.797.1915.618.41
BUFFALO EARLY STAGE GROWTH FUND - Institutional4.834.837.45-7.107.947.3415.788.57
  Russell 2000 Growth Index7.587.5820.35-2.687.387.8913.398.84

2013201420152016201720182019202020212022
BUFFALO EARLY STAGE GROWTH FUND - Investor61.70-7.38-9.4111.0527.18-3.9534.0347.697.79-30.76
BUFFALO EARLY STAGE GROWTH FUND - Institutional61.94-7.24-9.2811.2227.37-3.8134.2047.967.94-30.66
  Russell 2000 Growth Index43.305.60-1.3811.3222.17-9.3128.4834.632.83-26.36
  Morningstar U.S. Small Growth Index41.862.46-0.189.6123.77-5.6727.6043.52-1.00-33.31
For performance prior to 7/1/19 (Inception Date of Institutional Class), performance of the Investor Class shares is used and includes expenses not applicable and lower than those of Investor Class shares. Performance data quoted represents past performance; past performance does not guarantee future results. The investment return and principal value of an investment will fluctuate so that an investor’s shares, when redeemed, may be worth more or less than their original cost. Current performance of the fund may be lower of higher than the performance quoted and can be obtained here. Performance is annualized for periods greater than 1 year. Each Morningstar category average represents a universe of funds with similar objectives.
3 Year Risk Metrics
BUFOX vs Russell 2000 Growth Index (As of 3/31/24)
Upside Capture85.92
Downside Capture103.45
Alpha-4.78
Beta0.95
Sharpe Ratio-0.46
Hypothetical Growth of $10,000

This chart illustrates the performance of a hypothetical $10,000 investment made in the Fund on the Inception Date. Assumes reinvestment of dividends and capital gains. This chart does not imply future performance.

Portfolio

Portfolio Characteristics
(As of 3/31/24) 
 
# of Holdings59
Median Market Cap$1.46 B
Weighted Average Market Cap$3.04 B
3-Yr Annualized Turnover Ratio21.95%
% of Holdings with Free Cash Flow72.88%
Active Share95.12%
Top 10 Holdings
HoldingTickerSector% of Net
Assets
Compass Diversified HoldingsCODIFinancials3.18
Bowman Consulting Group, Ltd.BWMNIndustrials3.17
Hamilton Lane Incorporated Class AHLNEFinancials3.11
Transcat, Inc.TRNSInformation Technology3.10
Calix, Inc.CALXInformation Technology2.95
ICF International, Inc.ICFIIndustrials2.86
Varonis Systems, Inc.VRNSInformation Technology2.75
NV5 Global IncNVEEIndustrials2.56
Cadre Holdings, Inc.CDREIndustrials2.54
Federal Signal CorporationFSSIndustrials2.52
TOP 10 HOLDINGS TOTAL28.75%
As of 12/31/23. Top 10 Holdings for the quarter are not disclosed until 60 days after quarter end. Fund holdings are subject to change and are not recommendations to buy or sell any securities.
Sector Weighting

As of 3/31/24. Security weightings are subject to change and are not recommendations to buy or sell any securities. Sector Allocation may not equal 100% due to rounding.

Market Capitalization

As of 3/31/24. Market Cap percentages may not equal 100% due to rounding.

Management

Craig Richard, CFA
Portfolio Manager

21 Years of Experience

 View full bio

Doug Cartwright, CFA
Portfolio Manager

17 Years of Experience

 View full bio

Commentary

PERFORMANCE COMMENTARY

(As of 12/31/23)

The Buffalo Early Stage Growth Fund generated a return of 9.75% for the quarter
compared to the Russell 2000 Growth Index return of 12.75% during the period.
For calendar year 2023, the fund returned 9.83%. Small caps trailed their large cap
counterparts significantly in 2023 with the Russell 1000 Growth (Large Cap) Index leading
the way up 42.68%, the Russell Midcap Growth Index advanced 25.87% and the Russell
2000 Growth (Small Cap) climbed 18.66%. Further on down the market cap spectrum, the
Russell Microcap Growth Index produced a return of 9.11% in 2023.

The fund is positioned at the smaller end of the small cap spectrum as measured by the
portfolio’s weighted average market cap. This presented a consistent headwind in 2023
given the underperformance of smaller companies in the index.

On a sector basis, the fund underperformed in both the Healthcare and Technology sectors
in the quarter. This was partially offset by outperformance in the fund’s Industrials holdings.

In terms of individual stock detractors in the quarter, Establishment Labs again
represented a material contributor to underperformance in the quarter. Establishment
Labs (ESTA) is a long-time holding of the fund that came under significant pressure
in the second half of calendar 2023. The company is an innovator in the Healthcare
sector, bringing innovation to the breast augmentation and reconstruction space that has not had material innovation for close to 20 years. The company is currently in 80
countries, establishing leading market shares of greater than 30%, and most importantly,
has a superior safety profile to legacy breast implant manufacturers. The incremental
pressure on the shares in the quarter was due to significant slowing of demand for breast
augmentation procedures in foreign geographies. Over half of all revenue comes from
distributors who serve plastic surgeon practices. As the consumer showed some signs of
weakness and economic conditions tightened, distributors put the brakes on orders and
started to draw down existing inventories versus continuing to replenish. Additionally, the
approval of the company’s breast implants into the Chinese market remained delayed. The
shares have rallied in early 2024 on the news of approval to enter the Chinese market and
indications that distributor inventory destocking is behind them. Additionally, investors are
refocused on the pending approval to enter the U.S. market which represents over half
the global opportunity.

Kinsale Capital Group was another large individual drag to performance during the
quarter. Kinsale is a specialty insurer focused solely on excess and surplus (E&S) lines.
Gross premiums written grew 34% in the third quarter, which disappointed investors
who had become accustomed to growth in the 40%s and 50%s. While the business will
inevitably show signs of cyclicality over time, we expect the company’s technology platform
and focus on E&S policies will allow them to continue to outperform in the segment. Kinsale enjoys a significant cost advantage over its peers which should allow it to continue
to capture market share. In the E&S space, Kinsale has a 1-2% market share and continues
to grow aggressively with the largest players in the space having 15% market share. There
remains plenty of runway to allow Kinsale to continue to grow at an attractive rate as
the E&S market continues to grow as a percentage of the overall property and casualty
insurance marketplace.

On the positive side, Shift4 Payments was a recent addition to the Fund in the fourth
quarter that performed well and was one of the top individual contributors. Shift4
is an integrated payments company with a legacy of providing payment solutions
to the hospitality sector (hotels/restaurants). They have expanded into professional
sports venues and are near agreements to launch ticketing solutions to go along with
concessions. Additionally, they are just beginning international expansion through a recent
acquisition. Along with delivering strong growth in the third quarter, the shares were
bolstered by potential takeout interest given what we felt was a disconnect between the
valuation and the results the company has been producing


OUTLOOK

(As of 12/31/23)

While the employment environment remains strong, excess household savings
accumulated during the pandemic are closer to being exhausted. In the fourth quarter,
the Fed signaled a more dovish outlook and paused its aggressive interest rate hikes
that began in March of 2022. As a result, small cap stocks experienced a sharp rebound
intra fourth quarter with the Russell 2000 Growth Index rising approximately 25% from
late October through the calendar year end.

As the economy shows continuing signs of growth and the Fed moves to a position of
lowering interest rates and halts quantitative tightening, we are becoming increasingly
more positive on the outlook for small cap stocks. Valuation levels of small caps relative
to large caps remain at historically attractive levels. Additionally, the performance gap
between small cap stocks and large cap stocks remains wide relative to historical levels,
and we believe this performance gap will compress.

Our job remains to find and hold attractive small cap companies that have not been fully
appreciated by the market or are mispriced due to recent results or events. We believe
less investor interest in this segment of the market creates an opportunity for us to
uncover value over the long term.

The fund typically invests at the smaller end of the small cap growth spectrum and the
managers continue to seek companies with sustainable growth due to secular growth
trends or innovative, disruptive products. The Buffalo Early Stage Growth Fund is
focused primarily on identifying innovation within U.S. companies with primarily North
American revenue bases. With an active share of greater than 90%, a lower turnover
strategy with 50-70 holdings, the fund aims to continue to offer a distinct offering from
the Index and category peers.

The opinions expressed are those of the Portfolio Manager(s) and are subject to change, are not guaranteed and should not be considered recommendations to buy or sell any security. Earnings growth is not representative of the fund’s future performance.

Literature

Buffalo Early Stage Growth
Documents
Last
Updated
  Fact Sheet3/31/24
  Quarterly Commentary12/31/23
  Full Fund Holdings6/30/23
  Prospectus7/28/23
  Statement of Additional Information7/28/23
  Annual Report3/31/23
  Semi-Annual Report9/30/22
  Tax Guide - 20231/8/24
General Account
Forms
Investor
Class
Institutional
Class
Both
  New Account Application
  New Account Application - Entity
  Change or Add Account Details
  Cost Basis Method Election
  Power of Attorney
Individual Retirement Account (IRA) Forms
  IRA Account Application
  IRA Beneficiary Addition / Change
  IRA Required Minimum Distribution (RMD)
  IRA / Qualified Plan Distribution Request
  IRA Transfer
Coverdell Education Savings Accounts (ESA) Forms
  Coverdell ESA Application
  Coverdell ESA Distribution Request
  Coverdell ESA Transfer
Retirement Information
  Retirement Savings Options for Individuals

Fundamental Approach

We get to know the companies we invest in and learn how they run their business.

Top-Down & Bottom-Up

We identify Top-Down broad, secular growth trends and search for companies from the Bottom-Up.

Proprietary Philosophy

We construct our portfolios based on our own proprietary investment strategy.

Disciplined Investing

Sticking to our disciplined investment strategy ensures we maintain a consistent, balanced approach.

The Morningstar Rating™ for funds, or "star rating", is calculated for managed products (including mutual funds, variable annuity and variable life subaccounts, exchange-traded funds, closed-end funds, and separate accounts) with at least a three-year history. Exchange-traded funds and open-ended mutual funds are considered a single population for comparative purposes. It is calculated based on a Morningstar Risk-Adjusted Return measure that accounts for variation in a managed product's monthly excess performance, placing more emphasis on downward variations and rewarding consistent performance. The top 10% of products in each product category receive 5 stars, the next 22.5% receive 4 stars, the next 35% receive 3 stars, the next 22.5% receive 2 stars, and the bottom 10% receive 1 star. The Overall Morningstar Rating™ for a managed product is derived from a weighted average of the performance figures associated with its three-, five-, and 10-year (if applicable) Morningstar Rating™ metrics. The weights are: 100% three-year rating for 36-59 months of total returns, 60% five-year rating/40% three-year rating for 60-119 months of total returns, and 50% 10-year rating/30% five-year rating/20% three-year rating for 120 or more months of total returns. While the 10-year overall star rating formula seems to give the most weight to the 10-year period, the most recent three-year period actually has the greatest impact because it is included in all three rating periods.

The Buffalo Early Stage Growth Fund (BUFOX) received 2 stars among 552 for the three-year, 2 stars among 520 for the five-year, and 2 stars among 400 Small Growth funds for the ten-year period ending 3/31/24.

Finding Small-Cap Innovators in Technology

Finding Small-Cap Innovators in Technology

Media Coverage

Finding Small-Cap Innovators in Technology

Buffalo Funds Early Stage Growth co-portfolio manager Craig Richard, CFA, was recently interviewed by The Wall Street Transcript where he discusses IPOs and being overweight in the technology sector. In the article, Craig also cites several examples of companies within the Fund’s portfolio that highlight the team’s investment strategy at work:

  • Open Lending (NASDAQ: LPRO)
  • 1847 Goedeker (NYSEAMERICAN: GOED)
  • Establishment Labs (NASDAQ: ESTA)

As an early stage growth fund, we’re looking for disruptive share gainers, and historically, the technology sector in the small-cap universe has been a good source for those type of names. ~ Craig Richard, CFA, Co-Portfolio Manager, Buffalo Early Stage Growth Fund

To access The Wall Street Transcript article click here. (subscription required)

Diversification does not assure a profit, nor does it protect against a loss in a declining market. Past performance does not guarantee future results. Earnings growth is not representative of the fund’s future performance. Opinions expressed are those of the author or Funds as of 9/13/21 and are subject to change, are not intended to be a forecast of future events, a guarantee of future results, nor investment advice. References to other mutual funds should not to be considered an offer to buy or sell these securities. A complete list of the Fund’s holdings can be found here. Fund holdings are subject to change and should not be considered a recommendation to buy or sell any security.

EBITDA stands for earnings before interest, taxes, depreciation and amortization. EBITDA is one indicator of a company’s financial performance and is used as a proxy for a company’s current operating profitability. Net-debt-to-EBITDA ratio is a measurement of leverage, calculated as a company’s interest-bearing liabilities minus cash or cash equivalents, divided by its EBITDA. The net debt-to-EBITDA ratio is a debt ratio that shows how many years it would take for a company to pay back its debt if net debt and EBITDA are held constant. Short interest is the number of shares that have been sold short but have not yet been covered or closed out. A special purpose acquisition company (SPAC) is a company with no commercial operations that is formed strictly to raise capital through an initial public offering (IPO) for the purpose of acquiring an existing company. Enterprise value is a measure of a company’s total value, often used as a more comprehensive alternative to equity market capitalization. The enterprise value to earnings before interest, taxes, depreciation, and amortization ratio (EV/EBITDA) compares the value of a company—debt included—to the company’s cash earnings less non-cash expenses. A basis point is one hundredth of a percentage point (0.01%). Active share is a measure of the percentage of stock holdings in a manager’s portfolio that differs from the benchmark index. The Russell 2000 Growth Index measures the performance of those Russell 2000 Index companies with higher price-to-book ratios and higher forecasted growth values. It is not possible to invest directly in an index.

Early Stage Growth Fund

Early Stage Growth Fund

Total Assets $132.43 Million  (12/31/21)
Expense Ratio 1.51% / 1.36%
Benchmark Morningstar U.S. Small Growth

Sign Up for Automatic Updates

Stay up-to-date with the most recent media coverage and press releases about the Buffalo Funds.

FOR FINANCIAL PROFESSIONALS

Terms of Use – Email lists are created for use by U.S. investment professionals only and are published strictly for informational purposes. Providing access to the content of these emails does not explicitly or implicitly constitute a solicitation of services or products of the Buffalo Funds, Kornitzer Capital Management, or any of their affiliates. The information contained in the emails is not intended for distribution to, or for use by, investment professionals in a jurisdiction where distribution or purchase is not authorized. The information contained in these emails is not appropriate for use by individual investors. By registering for any of these emails, you agree to Buffalo's terms and conditions and that you are qualified as an institutional investor or otherwise member of a registered broker/dealer, registered investment advisor, or investment consulting firm.

FOR INDIVIDUAL INVESTORS

“Money Life Market Call” with Buffalo Early Stage Growth Fund PM Doug Cartwight

“Money Life Market Call” with Buffalo Early Stage Growth Fund PM Doug Cartwight

Media Coverage

“Money Life Market Call” with Buffalo Early Stage Growth Fund PM Doug Cartwight

Overview

Buffalo Funds Early Stage Growth co-portfolio manager Doug Cartwright, CFA, recently appeared on the “Money Life with Chuck Jaffe” podcast.

During the call, Doug goes in-depth on small-cap investing, providing an overview of his investment methodology, and also provides his thoughts on the following companies:

  • Overstock.com (NASDAQ: OSTK)
  • Accel Entertainment (NYSE: ACEL)
  • DraftKings (NASDAQ: DKNG)
  • Rush Street Interactive (NYSE: RSI)
  • Community Healthcare Trust (NYSE: CHCT)
  • Trupanion (NASDAQ: TRUP)
  • LendingTree (NASDAQ: TREE)

We define early stage as having a new product or a new service or a new way of going to market or a new way of doing things. And then we tend to look at companies that are disruptive either because they have a superior product or a better way of doing things or a better way of going to market.

~ Doug Cartwright, CFA, Co-Portfolio Manager, Buffalo Early Stage Growth Fund

MORE ABOUT DOUG


Doug Cartwright, CFA
Portfolio Manager
15 Years of Experience
 View full bio

Opinions expressed are those of the author or Funds as of 8/17/21 and are subject to change, are not intended to be a forecast of future events, a guarantee of future results, nor investment advice. A full listing of the Buffalo Early Stage Growth Fund portfolio holdings can be found here. Past performance does not guarantee future results.

EBITDA stands for earnings before interest, taxes, depreciation and amortization. EBITDA is one indicator of a company’s financial performance and is used as a proxy for a company’s current operating profitability. Cashflow is a measure of the cash produced by the firm in a given period on behalf of equity holders. The true measure of the value of a firm’s equity is considered to be the present value of all free cash flows. The S&P 500 is a capitalization weighted index of 500 large capitalization stocks which is designed to measure broad domestic securities markets. The Russell 2000 Growth Index, also referred to as the small cap growth index, is an unmanaged index that measures the performance of those Russell 2000 Index companies with higher price-to-book ratios and higher forecasted growth values. It is not possible to invest directly in an index.

As of 3/31/21 the Buffalo Early Stage Growth Fund top 10 equity holdings were 8×8 2.94%, Open Lending Corp 2.59%, NV5 Global 2.50%, Shutterstock 2.33%, Omnicell 2.31%, Mimecast 2.25%, EverQuote 2.06%, Patrick Industries 1.94%, Compass Diversified 1.87%, Absolute Software Corp 1.86%. Top 10 holdings for the quarter are not disclosed until 60 days after quarter end. Fund holdings are subject to change and are not recommendations to buy or sell any securities.

Sign Up for Automatic Updates

Stay up-to-date with the most recent media coverage and press releases about the Buffalo Funds.

FOR FINANCIAL PROFESSIONALS

Terms of Use – Email lists are created for use by U.S. investment professionals only and are published strictly for informational purposes. Providing access to the content of these emails does not explicitly or implicitly constitute a solicitation of services or products of the Buffalo Funds, Kornitzer Capital Management, or any of their affiliates. The information contained in the emails is not intended for distribution to, or for use by, investment professionals in a jurisdiction where distribution or purchase is not authorized. The information contained in these emails is not appropriate for use by individual investors. By registering for any of these emails, you agree to Buffalo's terms and conditions and that you are qualified as an institutional investor or otherwise member of a registered broker/dealer, registered investment advisor, or investment consulting firm.

FOR INDIVIDUAL INVESTORS

Kiplinger: Top-Performing Mutual Funds

Media Coverage

Kiplinger: Top-Performing Mutual Funds

Overview

Kiplinger recognized the Buffalo Small Cap, Early Stage Growth, and International Funds as “Top-Performing Mutual Funds” in their recent fund analysis for the period ending July 31, 2021.

The Buffalo Small Cap Fund (BUFSX) ranked #5 in the Small-Company Stock Funds category for the 20-year annualized return based on Morningstar’s universe of 25,000+ funds. (BUFSX was not ranked in the top 10 for the 1, 3, 5, or 10-year time period)

The Buffalo Early Stage Growth Fund (BUFOX) ranked #9 in the Small-Company Stock Funds category for the 10-year annualized return. (BUFOX was not ranked in the top 10 for the 1, 3, 5, or 20-year time periods)

The Buffalo International Fund (BUFIX) ranked #10 in the International Diversified Large-Company Funds category for the 5-year annualized return. (BUFIX was not ranked in the top 10 for the 1, 3, 10, or 20-year time periods)

Management Teams:

Performance data quoted represents past performance; past performance does not guarantee future results. The investment return and principal value of an investment will fluctuate so that an investor’s shares, when redeemed, may be worth more or less than their original cost. Current performance of the funds may be lower of higher than the performance quoted. Quarter-end performance can be obtained here and month-end performance can be obtained here.
Small Cap Fund

Small Cap Fund

Total Assets $1.16 Billion  (12/31/21)
Expense Ratio 1.01% / 0.86%
Benchmark Morningstar U.S. Small Growth

Early Stage Growth Fund

Early Stage Growth Fund

Total Assets $132.43 Million  (12/31/21)
Expense Ratio 1.51% / 1.36%
Benchmark Morningstar U.S. Small Growth

International Fund

International Fund

Total Assets $659.78 Million  (12/31/21)
Expense Ratio 1.04% / 0.89%
Benchmark Morningstar Global Markets ex-US

Sign Up for Automatic Updates

Stay up-to-date with the most recent media coverage and press releases about the Buffalo Funds.

FOR FINANCIAL PROFESSIONALS

Terms of Use – Email lists are created for use by U.S. investment professionals only and are published strictly for informational purposes. Providing access to the content of these emails does not explicitly or implicitly constitute a solicitation of services or products of the Buffalo Funds, Kornitzer Capital Management, or any of their affiliates. The information contained in the emails is not intended for distribution to, or for use by, investment professionals in a jurisdiction where distribution or purchase is not authorized. The information contained in these emails is not appropriate for use by individual investors. By registering for any of these emails, you agree to Buffalo's terms and conditions and that you are qualified as an institutional investor or otherwise member of a registered broker/dealer, registered investment advisor, or investment consulting firm.

FOR INDIVIDUAL INVESTORS

Kiplinger: Top-Performing Mutual Funds

Media Coverage

Kiplinger: Top-Performing Mutual Funds

Overview

Kiplinger recognized the Buffalo Small Cap and Early Stage Growth Funds as “Top-Performing Mutual Funds” in their recent fund analysis for the period ending June 30, 2021.

The Buffalo Small Cap Fund (BUFSX) ranked #5 in the Small-Company Stock Funds category for the 20-year annualized return, #9 for 10-year annualized returns, #10 for 5-year annualized returns, and #9 for 3-year annualized returns, based on Morningstar’s universe of 25,000+ funds. (BUFSX was not ranked in the top 10 for the 1-year time period)

The Buffalo Early Stage Growth Fund (BUFOX) ranked #8 in the Small-Company Stock Funds category for the 10-year annualized return. (BUFOX was not ranked in the top 10 for the 1-, 3-, 5-, or 20-year time periods)

Management Teams:

Performance data quoted represents past performance; past performance does not guarantee future results. The investment return and principal value of an investment will fluctuate so that an investor’s shares, when redeemed, may be worth more or less than their original cost. Current performance of the funds may be lower of higher than the performance quoted. Quarter-end performance can be obtained here and month-end performance can be obtained here.
Small Cap Fund

Small Cap Fund

Total Assets $1.16 Billion  (12/31/21)
Expense Ratio 1.01% / 0.86%
Benchmark Morningstar U.S. Small Growth

Early Stage Growth Fund

Early Stage Growth Fund

Total Assets $132.43 Million  (12/31/21)
Expense Ratio 1.51% / 1.36%
Benchmark Morningstar U.S. Small Growth

Sign Up for Automatic Updates

Stay up-to-date with the most recent media coverage and press releases about the Buffalo Funds.

FOR FINANCIAL PROFESSIONALS

Terms of Use – Email lists are created for use by U.S. investment professionals only and are published strictly for informational purposes. Providing access to the content of these emails does not explicitly or implicitly constitute a solicitation of services or products of the Buffalo Funds, Kornitzer Capital Management, or any of their affiliates. The information contained in the emails is not intended for distribution to, or for use by, investment professionals in a jurisdiction where distribution or purchase is not authorized. The information contained in these emails is not appropriate for use by individual investors. By registering for any of these emails, you agree to Buffalo's terms and conditions and that you are qualified as an institutional investor or otherwise member of a registered broker/dealer, registered investment advisor, or investment consulting firm.

FOR INDIVIDUAL INVESTORS

Kiplinger: Top-Performing Mutual Funds

Media Coverage

Kiplinger: Top-Performing Mutual Funds

Overview

Kiplinger recognized the Buffalo Small Cap and Early Stage Growth Funds as “Top-Performing Mutual Funds” in their recent fund analysis for the period ending May 31, 2021.

The Buffalo Small Cap Fund (BUFSX) ranked #4 in the Small-Company Stock Funds category for the 20-year annualized return, #9 for 3-year annualized returns, and #10 for 5-year annualized returns, based on Morningstar’s universe of 25,000+ funds. (BUFSX was not ranked in the top 10 for the 1- or 10-year time periods)

The Buffalo Early Stage Growth Fund (BUFOX) ranked #7 in the Small-Company Stock Funds category for the 10-year annualized return. (BUFOX was not ranked in the top 10 for the 1-, 3-, 5-, or 20-year time periods)

Management Teams:

Performance data quoted represents past performance; past performance does not guarantee future results. The investment return and principal value of an investment will fluctuate so that an investor’s shares, when redeemed, may be worth more or less than their original cost. Current performance of the funds may be lower of higher than the performance quoted. Quarter-end performance can be obtained here and month-end performance can be obtained here.
Small Cap Fund

Small Cap Fund

Total Assets $1.16 Billion  (12/31/21)
Expense Ratio 1.01% / 0.86%
Benchmark Morningstar U.S. Small Growth

Early Stage Growth Fund

Early Stage Growth Fund

Total Assets $132.43 Million  (12/31/21)
Expense Ratio 1.51% / 1.36%
Benchmark Morningstar U.S. Small Growth

Sign Up for Automatic Updates

Stay up-to-date with the most recent media coverage and press releases about the Buffalo Funds.

FOR FINANCIAL PROFESSIONALS

Terms of Use – Email lists are created for use by U.S. investment professionals only and are published strictly for informational purposes. Providing access to the content of these emails does not explicitly or implicitly constitute a solicitation of services or products of the Buffalo Funds, Kornitzer Capital Management, or any of their affiliates. The information contained in the emails is not intended for distribution to, or for use by, investment professionals in a jurisdiction where distribution or purchase is not authorized. The information contained in these emails is not appropriate for use by individual investors. By registering for any of these emails, you agree to Buffalo's terms and conditions and that you are qualified as an institutional investor or otherwise member of a registered broker/dealer, registered investment advisor, or investment consulting firm.

FOR INDIVIDUAL INVESTORS