Early Stage Growth Fund

Early Stage Growth Fund

Quick Facts
Investor Institutional
Ticker: BUFOX BUIOX
Daily Pricing:  
As of 4/17/2024  
NAV: $14.95 $15.07
$ Change: $-0.14 $-0.14
% Change:
-0.93% -0.92%
YTD:
-3.05% -3.02%
Inception Date: 5/21/2004 7/1/2019
Expense Ratio: 1.50% 1.35%
Total Net Assets: $78.20 Million  (3/31/24)
Morningstar Category: Small Cap Growth
Benchmark Index: Russell 2000 Growth
Related Material:
   Fund Fact Sheet Q1 2024
   PM Commentary Q4 2023
Recent Media Coverage
Fund Objective & Investment Process

The investment objective of the Buffalo Early Stage Growth Fund is long-term growth of capital. The Fund invests primarily in equity securities, consisting of common stocks, preferred stocks, convertible securities, warrants and rights, of companies that, at the time of purchase by the Fund, are defined as early stage growth companies. Early stage growth companies are defined by the Fund as companies that, at the time of purchase by the Fund, have market capitalizations below the median of the Russell 2000 Growth Index and are companies that are starting to develop a new product or service or have recently developed a new product or service.

The Fund managers seek to identify companies for the Fund’s portfolio that are expected to experience growth based on the identification of long-term, measurable secular trends, and which, as a result, may have potential revenue growth in excess of the gross domestic product growth rate. Companies are screened using in-depth, in-house research to identify premier early-stage growth companies which generally demonstrate:

  • Strong management teams
  • Little or no debt
  • Potential for increasing free cash flow
  • Scalable business models with a competitive advantage
  • Potential for increasing margins
  • Attractive risk/reward given the market framework
|

We believe investing in an actively-managed portfolio of premier, early-stage, growth companies could lead to growth of capital over time. We look for companies that could benefit from long-term industrial, technological, or general market trends, and are trading at what we view as attractive valuations.

Craig Richard, Portfolio Manager

Morningstar Rating


Overall Morningstar Rating™ of BUFOX based on risk-adjusted returns among 552 Small Growth funds as of 3/31/24.
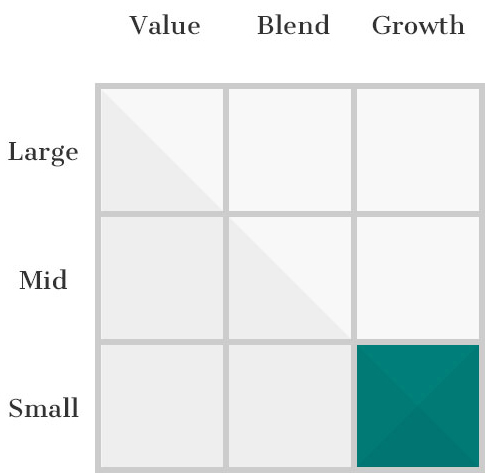
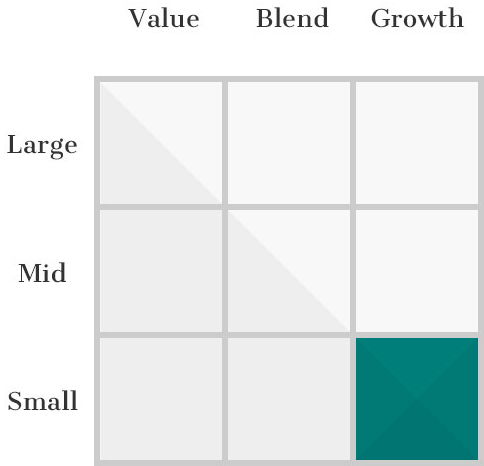
Investment Style

Performance (%)

As of 3/31/243 MOYTD1 YR3 YR5 YR10 YR15 YRSince Inception
BUFFALO EARLY STAGE GROWTH FUND - Investor4.804.807.38-7.247.797.1915.618.41
BUFFALO EARLY STAGE GROWTH FUND - Institutional4.834.837.45-7.107.947.3415.788.57
  Russell 2000 Growth Index7.587.5820.35-2.687.387.8913.398.84
As of 3/31/243 MOYTD1 YR3 YR5 YR10 YR15 YRSince Inception
BUFFALO EARLY STAGE GROWTH FUND - Investor4.804.807.38-7.247.797.1915.618.41
BUFFALO EARLY STAGE GROWTH FUND - Institutional4.834.837.45-7.107.947.3415.788.57
  Russell 2000 Growth Index7.587.5820.35-2.687.387.8913.398.84

2013201420152016201720182019202020212022
BUFFALO EARLY STAGE GROWTH FUND - Investor61.70-7.38-9.4111.0527.18-3.9534.0347.697.79-30.76
BUFFALO EARLY STAGE GROWTH FUND - Institutional61.94-7.24-9.2811.2227.37-3.8134.2047.967.94-30.66
  Russell 2000 Growth Index43.305.60-1.3811.3222.17-9.3128.4834.632.83-26.36
  Morningstar U.S. Small Growth Index41.862.46-0.189.6123.77-5.6727.6043.52-1.00-33.31
For performance prior to 7/1/19 (Inception Date of Institutional Class), performance of the Investor Class shares is used and includes expenses not applicable and lower than those of Investor Class shares. Performance data quoted represents past performance; past performance does not guarantee future results. The investment return and principal value of an investment will fluctuate so that an investor’s shares, when redeemed, may be worth more or less than their original cost. Current performance of the fund may be lower of higher than the performance quoted and can be obtained here. Performance is annualized for periods greater than 1 year. Each Morningstar category average represents a universe of funds with similar objectives.
3 Year Risk Metrics
BUFOX vs Russell 2000 Growth Index (As of 3/31/24)
Upside Capture85.92
Downside Capture103.45
Alpha-4.78
Beta0.95
Sharpe Ratio-0.46
Hypothetical Growth of $10,000

This chart illustrates the performance of a hypothetical $10,000 investment made in the Fund on the Inception Date. Assumes reinvestment of dividends and capital gains. This chart does not imply future performance.

Portfolio

Portfolio Characteristics
(As of 3/31/24) 
 
# of Holdings59
Median Market Cap$1.46 B
Weighted Average Market Cap$3.04 B
3-Yr Annualized Turnover Ratio21.95%
% of Holdings with Free Cash Flow72.88%
Active Share95.12%
Top 10 Holdings
HoldingTickerSector% of Net
Assets
Compass Diversified HoldingsCODIFinancials3.18
Bowman Consulting Group, Ltd.BWMNIndustrials3.17
Hamilton Lane Incorporated Class AHLNEFinancials3.11
Transcat, Inc.TRNSInformation Technology3.10
Calix, Inc.CALXInformation Technology2.95
ICF International, Inc.ICFIIndustrials2.86
Varonis Systems, Inc.VRNSInformation Technology2.75
NV5 Global IncNVEEIndustrials2.56
Cadre Holdings, Inc.CDREIndustrials2.54
Federal Signal CorporationFSSIndustrials2.52
TOP 10 HOLDINGS TOTAL28.75%
As of 12/31/23. Top 10 Holdings for the quarter are not disclosed until 60 days after quarter end. Fund holdings are subject to change and are not recommendations to buy or sell any securities.
Sector Weighting

As of 3/31/24. Security weightings are subject to change and are not recommendations to buy or sell any securities. Sector Allocation may not equal 100% due to rounding.

Market Capitalization

As of 3/31/24. Market Cap percentages may not equal 100% due to rounding.

Management

Craig Richard, CFA
Portfolio Manager

21 Years of Experience

 View full bio

Doug Cartwright, CFA
Portfolio Manager

17 Years of Experience

 View full bio

Commentary

PERFORMANCE COMMENTARY

(As of 12/31/23)

The Buffalo Early Stage Growth Fund generated a return of 9.75% for the quarter
compared to the Russell 2000 Growth Index return of 12.75% during the period.
For calendar year 2023, the fund returned 9.83%. Small caps trailed their large cap
counterparts significantly in 2023 with the Russell 1000 Growth (Large Cap) Index leading
the way up 42.68%, the Russell Midcap Growth Index advanced 25.87% and the Russell
2000 Growth (Small Cap) climbed 18.66%. Further on down the market cap spectrum, the
Russell Microcap Growth Index produced a return of 9.11% in 2023.

The fund is positioned at the smaller end of the small cap spectrum as measured by the
portfolio’s weighted average market cap. This presented a consistent headwind in 2023
given the underperformance of smaller companies in the index.

On a sector basis, the fund underperformed in both the Healthcare and Technology sectors
in the quarter. This was partially offset by outperformance in the fund’s Industrials holdings.

In terms of individual stock detractors in the quarter, Establishment Labs again
represented a material contributor to underperformance in the quarter. Establishment
Labs (ESTA) is a long-time holding of the fund that came under significant pressure
in the second half of calendar 2023. The company is an innovator in the Healthcare
sector, bringing innovation to the breast augmentation and reconstruction space that has not had material innovation for close to 20 years. The company is currently in 80
countries, establishing leading market shares of greater than 30%, and most importantly,
has a superior safety profile to legacy breast implant manufacturers. The incremental
pressure on the shares in the quarter was due to significant slowing of demand for breast
augmentation procedures in foreign geographies. Over half of all revenue comes from
distributors who serve plastic surgeon practices. As the consumer showed some signs of
weakness and economic conditions tightened, distributors put the brakes on orders and
started to draw down existing inventories versus continuing to replenish. Additionally, the
approval of the company’s breast implants into the Chinese market remained delayed. The
shares have rallied in early 2024 on the news of approval to enter the Chinese market and
indications that distributor inventory destocking is behind them. Additionally, investors are
refocused on the pending approval to enter the U.S. market which represents over half
the global opportunity.

Kinsale Capital Group was another large individual drag to performance during the
quarter. Kinsale is a specialty insurer focused solely on excess and surplus (E&S) lines.
Gross premiums written grew 34% in the third quarter, which disappointed investors
who had become accustomed to growth in the 40%s and 50%s. While the business will
inevitably show signs of cyclicality over time, we expect the company’s technology platform
and focus on E&S policies will allow them to continue to outperform in the segment. Kinsale enjoys a significant cost advantage over its peers which should allow it to continue
to capture market share. In the E&S space, Kinsale has a 1-2% market share and continues
to grow aggressively with the largest players in the space having 15% market share. There
remains plenty of runway to allow Kinsale to continue to grow at an attractive rate as
the E&S market continues to grow as a percentage of the overall property and casualty
insurance marketplace.

On the positive side, Shift4 Payments was a recent addition to the Fund in the fourth
quarter that performed well and was one of the top individual contributors. Shift4
is an integrated payments company with a legacy of providing payment solutions
to the hospitality sector (hotels/restaurants). They have expanded into professional
sports venues and are near agreements to launch ticketing solutions to go along with
concessions. Additionally, they are just beginning international expansion through a recent
acquisition. Along with delivering strong growth in the third quarter, the shares were
bolstered by potential takeout interest given what we felt was a disconnect between the
valuation and the results the company has been producing


OUTLOOK

(As of 12/31/23)

While the employment environment remains strong, excess household savings
accumulated during the pandemic are closer to being exhausted. In the fourth quarter,
the Fed signaled a more dovish outlook and paused its aggressive interest rate hikes
that began in March of 2022. As a result, small cap stocks experienced a sharp rebound
intra fourth quarter with the Russell 2000 Growth Index rising approximately 25% from
late October through the calendar year end.

As the economy shows continuing signs of growth and the Fed moves to a position of
lowering interest rates and halts quantitative tightening, we are becoming increasingly
more positive on the outlook for small cap stocks. Valuation levels of small caps relative
to large caps remain at historically attractive levels. Additionally, the performance gap
between small cap stocks and large cap stocks remains wide relative to historical levels,
and we believe this performance gap will compress.

Our job remains to find and hold attractive small cap companies that have not been fully
appreciated by the market or are mispriced due to recent results or events. We believe
less investor interest in this segment of the market creates an opportunity for us to
uncover value over the long term.

The fund typically invests at the smaller end of the small cap growth spectrum and the
managers continue to seek companies with sustainable growth due to secular growth
trends or innovative, disruptive products. The Buffalo Early Stage Growth Fund is
focused primarily on identifying innovation within U.S. companies with primarily North
American revenue bases. With an active share of greater than 90%, a lower turnover
strategy with 50-70 holdings, the fund aims to continue to offer a distinct offering from
the Index and category peers.

The opinions expressed are those of the Portfolio Manager(s) and are subject to change, are not guaranteed and should not be considered recommendations to buy or sell any security. Earnings growth is not representative of the fund’s future performance.

Literature

Buffalo Early Stage Growth
Documents
Last
Updated
  Fact Sheet3/31/24
  Quarterly Commentary12/31/23
  Full Fund Holdings6/30/23
  Prospectus7/28/23
  Statement of Additional Information7/28/23
  Annual Report3/31/23
  Semi-Annual Report9/30/22
  Tax Guide - 20231/8/24
General Account
Forms
Investor
Class
Institutional
Class
Both
  New Account Application
  New Account Application - Entity
  Change or Add Account Details
  Cost Basis Method Election
  Power of Attorney
Individual Retirement Account (IRA) Forms
  IRA Account Application
  IRA Beneficiary Addition / Change
  IRA Required Minimum Distribution (RMD)
  IRA / Qualified Plan Distribution Request
  IRA Transfer
Coverdell Education Savings Accounts (ESA) Forms
  Coverdell ESA Application
  Coverdell ESA Distribution Request
  Coverdell ESA Transfer
Retirement Information
  Retirement Savings Options for Individuals

Fundamental Approach

We get to know the companies we invest in and learn how they run their business.

Top-Down & Bottom-Up

We identify Top-Down broad, secular growth trends and search for companies from the Bottom-Up.

Proprietary Philosophy

We construct our portfolios based on our own proprietary investment strategy.

Disciplined Investing

Sticking to our disciplined investment strategy ensures we maintain a consistent, balanced approach.

The Morningstar Rating™ for funds, or "star rating", is calculated for managed products (including mutual funds, variable annuity and variable life subaccounts, exchange-traded funds, closed-end funds, and separate accounts) with at least a three-year history. Exchange-traded funds and open-ended mutual funds are considered a single population for comparative purposes. It is calculated based on a Morningstar Risk-Adjusted Return measure that accounts for variation in a managed product's monthly excess performance, placing more emphasis on downward variations and rewarding consistent performance. The top 10% of products in each product category receive 5 stars, the next 22.5% receive 4 stars, the next 35% receive 3 stars, the next 22.5% receive 2 stars, and the bottom 10% receive 1 star. The Overall Morningstar Rating™ for a managed product is derived from a weighted average of the performance figures associated with its three-, five-, and 10-year (if applicable) Morningstar Rating™ metrics. The weights are: 100% three-year rating for 36-59 months of total returns, 60% five-year rating/40% three-year rating for 60-119 months of total returns, and 50% 10-year rating/30% five-year rating/20% three-year rating for 120 or more months of total returns. While the 10-year overall star rating formula seems to give the most weight to the 10-year period, the most recent three-year period actually has the greatest impact because it is included in all three rating periods.

The Buffalo Early Stage Growth Fund (BUFOX) received 2 stars among 552 for the three-year, 2 stars among 520 for the five-year, and 2 stars among 400 Small Growth funds for the ten-year period ending 3/31/24.

Growth Fund

Growth Fund

Quick Facts
Investor Institutional
Ticker: BUFGX BIIGX
Daily Pricing:  
As of 4/17/2024  
NAV: $31.80 $32.02
$ Change: $-0.22 $-0.22
% Change:
-0.69% -0.68%
YTD:
5.40% 5.47%
Inception Date: 5/19/1995 7/1/2019
Expense Ratio: 0.92% 0.77%
Total Net Assets: $178.94 Million  (3/31/24)
Morningstar Category: Large Cap Growth
Benchmark Index: Russell 3000 Growth
Related Material:
   Fund Fact Sheet Q1 2024
   PM Commentary Q4 2023
Fund Objective & Investment Philosophy

The investment objective of the Buffalo Growth Fund is long-term growth of capital. The Fund invests in common stocks and other equity securities, including preferred stock, convertible securities, warrants and rights, with a goal of maintaining at least 75% of the Fund’s portfolio in companies with market capitalizations greater than the median of the Russell 3000 Growth Index at the time of purchase or $5 billion, whichever is lower. The median market capitalization of the Russell 3000 Growth Index changes due to market conditions and also changes with the composition of the index.

With respect to the remaining 25% of the equity weighting of the Fund’s portfolio, the Fund may invest in companies of any size, including, but not limited to, those with market capitalizations less than the lower of the median of the Russell 3000 Growth Index or $5 billion, whichever is lower.

The Fund managers seek to identify companies that are expected to experience growth based on the identification of long-term, measurable secular trends, and which, as a result, the managers believe may have potential revenue growth in excess of the gross domestic product growth rate. Companies are screened using in-depth, in-house research to identify those which the managers believe have favorable attributes, including attractive valuation, strong management, conservative debt, free cash flow, scalable business models, and competitive advantages.

|

The Growth Fund invest in secular trend leaders: attractively-priced, financially-strong, well-managed companies across all market cap segments, which we believe are favorably positioned to harvest the lion’s share of big secular growth trends.

Dave Carlsen, CFA, Co-Portfolio Manager

Morningstar Ratings


Overall Morningstar Rating™ of BUFGX based on risk-adjusted returns among 1,111 Large Growth funds as of 3/31/24

Performance (%)

As of 3/31/243 MOYTD1 YR3 YR5 YR10 YR15 YR20 YRSince Inception
BUFFALO GROWTH FUND - Investor9.889.8836.019.2214.0312.2015.4410.2410.82
BUFFALO GROWTH FUND - Institutional9.959.9536.169.3714.1912.3615.6110.4110.99
  Russell 3000 Growth Index11.2311.2341.2137.9511.5417.8215.4317.5610.66
  Lipper Large Cap Growth Fund Index13.1413.1441.079.5816.3114.3016.2810.569.67

2013201420152016201720182019202020212022
BUFFALO GROWTH FUND - Investor35.408.882.644.8622.810.5131.9128.2921.69-31.13
BUFFALO GROWTH FUND - Institutional35.609.052.805.0222.990.6632.1128.4921.85-31.03
  Russell 3000 Growth Index34.2312.445.097.3929.59-2.1235.8538.2625.85-28.97
  Morningstar U.S. Growth Index33.3412.665.543.1629.520.7834.9044.6524.79-36.70
For performance prior to 7/1/19 (Inception Date of Institutional Class), performance of the Investor Class shares is used and includes expenses not applicable and lower than those of Investor Class shares.Performance data quoted represents past performance; past performance does not guarantee future results. The investment return and principal value of an investment will fluctuate so that an investor’s shares, when redeemed, may be worth more or less than their original cost. Current performance of the fund may be lower of higher than the performance quoted and can be obtained here. Performance is annualized for periods greater than 1 year. Each Morningstar category average represents a universe of funds with similar objectives.
3 Year Risk Metrics
BUFGX vs Russell 3000 Growth Index (As of 3/31/24)
Upside Capture97.13
Downside Capture103.74
Alpha-1.97
Beta0.99
Sharpe Ratio0.31
Hypothetical Growth of $10,000
This chart illustrates the performance of a hypothetical $10,000 investment made in the Fund on the Fund’s inception date. This chart does not imply future performance.

Portfolio

Portfolio Characteristics
(As of 3/31/24) 
 
# of Holdings41
Median Market Cap$138.80 B
Weighted Average Market Cap$1181.24 B
3-Yr Annualized Turnover Ratio11.30%
% of Holdings with Free Cash Flow95.12%
Active Share46.08%
Top 10 Holdings
Name of HoldingTickerSector% of Net
Assets
Microsoft CorporationMSFTInformation Technology12.16
Alphabet Inc. Class AGOOGCommunication Services9.78
Apple Inc.AAPLInformation Technology9.75
Amazon.com, Inc.AMZNConsumer Discretionary6.77
NVIDIA CorporationNVDAInformation Technology3.79
Meta Platforms Inc Class AMETACommunication Services3.43
Mastercard Incorporated Class AMAFinancials3.22
Adobe Inc.ADBEInformation Technology2.79
Visa Inc. Class AVFinancials2.77
Salesforce, Inc.CRMInformation Technology2.23
TOP 10 HOLDINGS TOTAL56.67%
As of 12/31/23. Top 10 Holdings for the quarter are not disclosed until 60 days after quarter end. Fund holdings are subject to change and are not recommendations to buy or sell any securities.
Sector Weighting

As of 3/31/24. Security weightings are subject to change and are not recommendations to buy or sell any securities. Sector Allocation may not equal 100% due to rounding.

Market Capitalization

As of 3/31/24. Market Cap percentages may not equal 100% due to rounding.

Management

Dave Carlsen, CFA
Portfolio Manager

31 Years of Experience

 View full bio

Josh West, CFA
Portfolio Manager

18 Years of Experience

 View full bio

Commentary

PERFORMANCE COMMENTARY

(As of 12/31/23)

The Buffalo Growth Fund gained 13.12% in the fourth quarter compared to the
Russell 3000 Growth Index return of 14.09%. Strong stock selection in the Consumer
and Technology sectors largely offset poor stock selection in the Health Care sector.
Within the Consumer sector, overweight positions in Amazon, Uber, and not owning
Tesla drove relative performance. Our performance in the tech sector was driven
by several software companies (Microsoft, Adobe, DoubleVerify, Intuit, Palo Alto
Networks, Salesforce, ServiceNow). Within Healthcare, life sciences and medical device
companies continued to underperform, but most of the underperformance was driven
by Establishment Labs (discussed on the following page).

Top Contributors
Shares of Microsoft advanced over 19% in the quarter. The company reported sales
and earnings ahead of street expectations, driven by strength across all business lines,
particularly Azure and personal computing. Microsoft has been investing heavily in the
development of AI-powered solutions across its various business segments, such as
using AI to enhance productivity and efficiency in its Azure cloud infrastructure, Search
and Office software suite. Microsoft should continue to grow their leading share in cloud
computing, gaming, and MS Office productivity applications.

Amazon.com shares rallied in the quarter, after the company reported a margin
driven earnings beat. The company continued to gain market share in North American
ecommerce and digital advertising markets. AWS growth stabilized with artificial
intelligence products growing rapidly. Looking forward, we expect Amazon to continue to
dominate ecommerce, benefit from growth in the public cloud, and continue to rapidly
grow advertising revenues.

Top Detractors
Within the Healthcare sector, Establishment Labs (ESTA) is bringing innovation to
the breast implant space that has not had material change for close to 20 years. Their
products offer a superior safety profile to that of legacy breast implant manufacturers,
and they are rolling out a less invasive procedure that could drive volume growth.
The incremental pressure on the shares in the calendar fourth quarter was due
to significant slowing of demand for breast augmentation procedures in foreign
geographies. Over half of the company’s revenue comes from distributors who serve
plastic surgeon practices. As the consumer showed some signs of weakness and
economic conditions tightened, distributors put the brakes on orders and started to
draw down existing inventories versus continuing to replenish. The shares have rallied
in early 2024 on the news of approval to enter the Chinese market and indications that
distributor inventory destocking is behind them. Additionally, investors are refocused
on the pending approval to enter the U.S. market which represents over half the global
opportunity.

Schlumberger, an oilfield services company that provides technology for reservoir
characterization, drilling, production, and processing was another detractor in the
quarter. Shares followed the price of oil lower during the quarter. Looking forward, we
expect Schlumberger to continue to benefit from years of underinvestment in global
energy production.

OUTLOOK

(As of 12/31/23)

In the first quarter of this year, investors were concerned that the Federal Reserve would
push the economy into recession with their rapid interest rate increases. In the second
quarter, investors became convinced that the Federal Reserve would be able to tame
inflation without killing economic expansion, also known as a “soft landing”. In the third
quarter, investors returned to fretting over a possible or probable recession again. In the
fourth quarter, the Federal Reserve signaled a more dovish position and a likely peak in
interest rates for this cycle. Investors cheered that outlook, and the prevailing view is again
for the economy to have a soft landing. We highlight this mainly to point out how fickle the
financial markets are and how quickly the prevailing view can change.

We do not know if there will be a recession this year, next year, or the year after, but we
remain focused on investing in businesses that will be larger and more profitable many
years from now and have the financial strength to weather a recession whenever one
occurs. Regardless of what happens with the economy or broader equity markets, we will
strive to maximize risk-adjusted returns in the portfolio by investing in attractively valued
businesses with solid growth opportunities, durable competitive advantages, scalable
business models, and exceptional management teams.

Thank you for your continued support.

The opinions expressed are those of the Portfolio Manager(s) and are subject to change, are not guaranteed and should not be considered recommendations to buy or sell any security. Investing in both actively and passively managed mutual funds involves risk and principal loss is possible. Earnings growth is not representative of the fund’s future performance.

Literature

General Account
Forms
Investor
Class
Institutional
Class
Both
  New Account Application
  New Account Application - Entity
  Change or Add Account Details
  Cost Basis Method Election
  Power of Attorney
Individual Retirement Account (IRA) Forms
  IRA Account Application
  IRA Beneficiary Addition / Change
  IRA Required Minimum Distribution (RMD)
  IRA / Qualified Plan Distribution Request
  IRA Transfer
Coverdell Education Savings Accounts (ESA) Forms
  Coverdell ESA Application
  Coverdell ESA Distribution Request
  Coverdell ESA Transfer
Retirement Information
  Retirement Savings Options for Individuals

Fundamental Approach

We get to know the companies we invest in and learn how they run their business.

Top-Down & Bottom-Up

We identify Top-Down broad, secular growth trends and search for companies from the Bottom-Up.

Proprietary Philosophy

We construct our portfolios based on our own proprietary investment strategy.

Disciplined Investing

Sticking to our disciplined investment strategy ensures we maintain a consistent, balanced approach.

Morningstar Rating™

The Morningstar Rating™ for funds, or "star rating", is calculated for managed products (including mutual funds, variable annuity and variable life subaccounts, exchange-traded funds, closed-end funds, and separate accounts) with at least a three-year history. Exchange-traded funds and open-ended mutual funds are considered a single population for comparative purposes. It is calculated based on a Morningstar Risk-Adjusted Return measure that accounts for variation in a managed product's monthly excess performance, placing more emphasis on downward variations and rewarding consistent performance. The Morningstar Rating does not include any adjustment for sales loads. The top 10% of products in each product category receive 5 stars, the next 22.5% receive 4 stars, the next 35% receive 3 stars, the next 22.5% receive 2 stars, and the bottom 10% receive 1 star. The Overall Morningstar Rating™ for a managed product is derived from a weighted average of the performance figures associated with its three-, five-, and 10-year (if applicable) Morningstar Rating™ metrics. The weights are: 100% three-year rating for 36-59 months of total returns, 60% five-year rating/40% three-year rating for 60-119 months of total returns, and 50% 10-year rating/30% five-year rating/20% three-year rating for 120 or more months of total returns. While the 10-year overall star rating formula seems to give the most weight to the 10-year period, the most recent three-year period actually has the greatest impact because it is included in all three rating periods.

©2022 Morningstar, Inc. All Rights Reserved. The information contained herein: (1) is proprietary to Morningstar; (2) may not be copied or distributed; and (3) is not warranted to be accurate, complete or timely. Neither Morningstar nor its content providers are responsible for any damages or losses arising from any use of this information. Past performance is no guarantee of future results.

The Buffalo Growth Fund (BUFGX) received 3 stars among 1,111 for the 3-year, 3 stars among 1,037 for the 5-year, and 3 stars among 807 Large Growth funds for the 10-year period ending 3/31/24. Other share classes may have different performance characteristics.

Mid Cap Fund

Mid Cap Fund

Quick Facts
Investor Institutional
Ticker: BUFMX BUIMX
Daily Pricing:  
As of 4/17/2024  
NAV: $15.81 $15.94
$ Change: $-0.11 $-0.11
% Change:
-0.69% -0.69%
YTD:
-2.83% -2.80%
Inception Date: 12/17/2001 7/1/2019
Expense Ratio: 1.03% 0.88%
Total Net Assets: $157.09 Million  (3/31/24)
Morningstar Category: Mid Cap Growth
Benchmark Index: Russell Midcap Growth
Related Material:
   Fund Fact Sheet Q1 2024
   PM Commentary Q4 2023
Fund Objective & Investment Strategy

The investment objective of the Buffalo Mid Cap Fund is long-term growth of capital. The Fund normally invests at least 80% of its net assets in equity securities, consisting of common stocks, preferred stocks, convertible preferred stocks, warrants and rights of medium capitalization (“mid-cap”) companies. The Fund defines mid-cap companies as those companies that, at the time of purchase, have market capitalizations within the range of the Russell Midcap Growth Index.

The Fund managers seek to identify companies for the Mid Cap Fund’s portfolio that are expected to experience growth based on the identification of long-term, measurable secular trends, and which, as a result, the managers believe may have potential revenue growth in excess of the gross domestic product growth rate. Companies are screened using in-depth, in-house research to identify those which the managers believe have favorable attributes, including attractive valuation, strong management, conservative debt, free cash flow, scalable business models, and competitive advantages.

|

Our focus has always been on investing in secular growth companies we believe are attractively-priced with strong balance sheets. We remain convinced the inefficiencies inherent in the small and mid-cap market spectrum, in addition to where we are in the economic cycle, are best suited for disciplined, active management of the portfolio.

Josh West, Portfolio Manager

Morningstar Ratings


Overall Morningstar Rating™ of BUFMX based on risk-adjusted returns among 520 Mid-Cap Growth funds as of 3/31/24.

Performance (%)

As of 3/31/243 MOYTD1 YR3 YR5 YR10 YR15 YR20 YRSince Inception
BUFFALO MID CAP FUND - Investor6.026.0223.742.1211.408.9812.858.648.78
BUFFALO MID CAP FUND - Institutional6.046.0423.852.2711.569.1313.028.808.94
  Russell Midcap Growth Index9.509.5026.284.6211.8211.3515.6410.419.77
  Lipper Mid Cap Growth Index8.348.3421.200.339.509.7813.949.508.61

2013201420152016201720182019202020212022
BUFFALO MID CAP FUND - Investor29.255.85-0.525.9313.66-7.3037.9834.1814.61-27.80
BUFFALO MID CAP FUND - Institutional29.456.00-0.376.0813.82-7.1638.1634.4214.73-27.69
  Russell Midcap Growth Index35.7411.90-0.207.3325.27-4.7535.4735.5912.73-26.72
  Morningstar U.S. Mid Growth Index34.079.77-0.716.4625.67-3.1636.0146.1714.97-32.37

For performance prior to 7/1/19 (Inception Date of Institutional Class), performance of the Investor Class shares is used and includes expenses not applicable and lower than those of Investor Class shares.Performance data quoted represents past performance; past performance does not guarantee future results. The investment return and principal value of an investment will fluctuate so that an investor’s shares, when redeemed, may be worth more or less than their original cost. Current performance of the fund may be lower of higher than the performance quoted and can be obtained here. Performance is annualized for periods greater than 1 year. Each Morningstar category average represents a universe of funds with similar objectives.

3 Year Risk Metrics
BUFMX vs Russell Midcap Growth Index (As of 3/31/24)
Upside Capture87.93
Downside Capture99.55
Alpha-2.01
Beta0.90
Sharpe Ratio-0.03
Hypothetical Growth of $10,000
This chart illustrates the performance of a hypothetical $10,000 investment made in the Fund on the Inception Date. Assumes reinvestment of dividends and capital gains. This chart does not imply future performance.

Portfolio

Portfolio Characteristics
(As of 3/31/24) 
 
# of Holdings56
Median Market Cap$16.96 B
Weighted Average Market Cap$31.91 B
3-Yr Annualized Turnover Ratio19.50%
% of Holdings with Free Cash Flow92.86%
Active Share83.76%
Top 10 Holdings
Name of HoldingTickerSector% of Net
Assets
MSCI Inc. Class AMSCIFinancials4.06
Gartner, Inc.ITInformation Technology3.89
CBRE Group, Inc. Class ACBREReal Estate3.49
IQVIA Holdings IncIQVHealth Care3.16
CrowdStrike Holdings, Inc. Class ACRWDInformation Technology3.08
Verisk Analytics IncVRSKIndustrials3.02
CoStar Group, Inc.CSGPIndustrials3.00
Copart, Inc.CPRTIndustrials2.73
AMETEK, Inc.AMEIndustrials2.54
Veeva Systems Inc Class AVEEVHealth Care2.53
TOP 10 HOLDINGS TOTAL31.49%
As of 12/31/23. Top 10 Holdings for the quarter are not disclosed until 60 days after quarter end. Fund holdings are subject to change and are not recommendations to buy or sell any securities.
Sector Weighting

As of 3/31/24. Security weightings are subject to change and are not recommendations to buy or sell any securities. Sector Allocation may not equal 100% due to rounding.

Market Capitalization

As of 3/31/24. Market Cap percentages may not equal 100% due to rounding.

Management

Josh West, CFA
Portfolio Manager

18 Years of Experience

 View full bio

Doug Cartwright, CFA
Portfolio Manager

17 Years of Experience

 View full bio

Commentary

PERFORMANCE COMMENTARY

(As of 12/31/23)

2023 concluded with capital markets moving higher in the final quarter of the year. The
S&P 500 Index gained 11.69% and the Bloomberg Aggregate Bond Index advanced
6.82%. A big pivot in expectations for the Federal Reserve’s monetary policy drove the
market advance during the period, as investors now anticipate a decline in interest
rates for 2024. The yield of the U.S. Treasury 10-year note finished the quarter at
3.88%, a significant drop from its peak of nearly 5% in mid-October.

Recapping broad-based index results, the Russell 3000 Index gained 12.07% during
the period. Growth stocks outperformed value stocks as the Russell 3000 Growth
Index advanced 14.09% compared to a gain of 9.83% for the Russell 3000 Value Index.
In typical “risk-on” fashion, relative performance improved going down in market
capitalization (size) during the quarter as small caps advanced more than large caps.
Larger cap stocks produced a return of 11.96%, as measured by the Russell 1000
Index, compared to the smaller cap Russell 2000 Index return of 14.03%. The even
smaller market cap Russell Microcap Index rallied 16.06% in the quarter.

The stock market recorded impressive gains for 2023 with the S&P 500 Index
advancing 26.29%. However, it was a “narrow” market as the “magnificent seven”
technology and artificial intelligence (AI) stocks accounted for approximate 80% of the
S&P 500’s gains in 2023, versus a broad market advance where hundreds of stocks
propel the index higher. In terms of economic sectors, technology, communication
services, and consumer discretionary stocks were the brightest spots while the utilities
and energy sectors declined in 2023.

The Buffalo Mid Cap Fund gained 14.22% in the fourth quarter compared to the
Russell Midcap Growth Index return of 14.55%. Strong stock selection in the
industrials, real estate, and information technology sectors mostly offset the drag from
poor selection in health care, consumer, and finance. Our small cash position was also
a modest drag on performance in the market rally.

Top Contributors
Gartner was the top contributor to fund results in the quarter. The company
provides research and advisory services, mainly on technology related topics, to
corporate clients. The stock advanced over 30% after reporting a beat and raise
quarter, highlighted by stabilizing tech vendor spending and salesforce productivity
improvements. While artificial intelligence is the current hot topic, we expect Gartner
will continue to benefit from the increasing ubiquity and complexity of IT in all types
of businesses.

Shares of cybersecurity firm Crowdstrike Holdings were up over 50% in the quarter.
Investors were surprised by Crowdstrike’s net new annual recurring revenue growth
of 13%, compared to previous estimates of 6%. Investors were also pleased with
the company’s improving win rates and expansion into cloud security and identity
protection. Crowdstrike should be well positioned to benefit from increasing spend
on endpoint security and cloud workload protection for years to come.

CBRE Group is the leading global provider of commercial real estate (CRE) services.
Its shares benefited from the pullback in interest rates seen in the quarter. Higher
interest rates have been a headwind to commercial real estate transactions. Also,
CBRE and some others in the industry made comments about seeing some green
shoots in capital markets activity. Looking through the cycles, CBRE should continue to
benefit from firms outsourcing CRE functions, consolidation of CRE spend with fewer
global providers, and increasing investor ownership in the CRE asset class.

Top Detractors
Kinsale Capital Group is a property and casualty insurer, focusing on excess
and surplus (E&S) lines. Gross premiums written grew 34% in the quarter, which
disappointed investors who had become accustomed to growth in the 40%s and 50%s.
While the business will inevitably show signs of cyclicality, the company’s technology
platform and focus on small E&S policies will allow Kinsale to continue growing at an
attractive rate without sacrificing on underwriting margins.

On Semiconductor, a supplier of semiconductors and sensors focused on automotive
and industrial markets, was a drag on performance in the quarter. The company
lowered guidance for silicon carbide revenue, citing weakness in demand from one top
electric vehicle customer. We continue to expect electric vehicles to become a larger
percentage of cars on the road over time, and On Semiconductor should benefit from
that trend.

OUTLOOK

(As of 12/31/23)

In the first quarter of 2023, investors were concerned that the Federal Reserve would
push the economy into recession with their rapid interest rate increases. In the second
quarter, investors became convinced that the Federal Reserve would be able to tame
inflation without killing economic expansion, also known as a “soft landing”. In the third
quarter, investors returned to fretting over a possible or probable recession again. In
the fourth quarter, the Federal Reserve signaled a more dovish position and a likely peak
in interest rates for this cycle. Investors cheered that outlook, and the prevailing view is
again for the economy to have a soft landing. We highlight this mainly to point out how
fickle the financial markets are and how quickly the prevailing view can change.

We do not know if there will be a recession this year, next year, or the year after, but
we remain focused on investing in businesses that will be larger and more profitable
many years from now and have the financial strength to weather a recession whenever
one occurs. Regardless of what happens with the economy or broader equity
markets, we will strive to maximize risk-adjusted returns in the portfolio by investing
in attractively valued businesses with solid growth opportunities, durable competitive
advantages, scalable business models, and exceptional management teams.

Thank you for your continued support.

The opinions expressed are those of the Portfolio Manager(s) and are subject to change, are not guaranteed and should not be considered recommendations to buy or sell any security. Earnings growth is not representative of the fund’s future performance.

Literature

General Account
Forms
Investor
Class
Institutional
Class
Both
  New Account Application
  New Account Application - Entity
  Change or Add Account Details
  Cost Basis Method Election
  Power of Attorney
Individual Retirement Account (IRA) Forms
  IRA Account Application
  IRA Beneficiary Addition / Change
  IRA Required Minimum Distribution (RMD)
  IRA / Qualified Plan Distribution Request
  IRA Transfer
Coverdell Education Savings Accounts (ESA) Forms
  Coverdell ESA Application
  Coverdell ESA Distribution Request
  Coverdell ESA Transfer
Retirement Information
  Retirement Savings Options for Individuals

Fundamental Approach

We get to know the companies we invest in and learn how they run their business.

Top-Down & Bottom-Up

We identify Top-Down broad, secular growth trends and search for companies from the Bottom-Up.

Proprietary Philosophy

We construct our portfolios based on our own proprietary investment strategy.

Disciplined Investing

Sticking to our disciplined investment strategy ensures we maintain a consistent, balanced approach.

Morningstar Rating™

The Morningstar Rating™ for funds, or "star rating", is calculated for managed products (including mutual funds, variable annuity and variable life subaccounts, exchange-traded funds, closed-end funds, and separate accounts) with at least a three-year history. Exchange-traded funds and open-ended mutual funds are considered a single population for comparative purposes. It is calculated based on a Morningstar Risk-Adjusted Return measure that accounts for variation in a managed product's monthly excess performance, placing more emphasis on downward variations and rewarding consistent performance. The Morningstar Rating does not include any adjustment for sales loads. The top 10% of products in each product category receive 5 stars, the next 22.5% receive 4 stars, the next 35% receive 3 stars, the next 22.5% receive 2 stars, and the bottom 10% receive 1 star. The Overall Morningstar Rating™ for a managed product is derived from a weighted average of the performance figures associated with its three-, five-, and 10-year (if applicable) Morningstar Rating™ metrics. The weights are: 100% three-year rating for 36-59 months of total returns, 60% five-year rating/40% three-year rating for 60-119 months of total returns, and 50% 10-year rating/30% five-year rating/20% three-year rating for 120 or more months of total returns. While the 10-year overall star rating formula seems to give the most weight to the 10-year period, the most recent three-year period actually has the greatest impact because it is included in all three rating periods.

©2022 Morningstar, Inc. All Rights Reserved. The information contained herein: (1) is proprietary to Morningstar; (2) may not be copied or distributed; and (3) is not warranted to be accurate, complete or timely. Neither Morningstar nor its content providers are responsible for any damages or losses arising from any use of this information. Past performance is no guarantee of future results.

The Buffalo Mid Cap Fund (BUFMX) received 3 stars among 520 for the 3-year, 4 stars among 489 for the 5-year, and 3 stars among 393 Mid-Cap Growth funds for the 10-year period ending 3/31/24. Other share classes may have different performance characteristics.

Small Cap Fund

Small Cap Fund

Quick Facts
Investor Institutional
Ticker: BUFSX BUISX
Daily Pricing:  
As of 4/17/2024  
NAV: $13.67 $13.77
$ Change: $-0.13 $-0.13
% Change:
-0.94% -0.94%
YTD:
-3.19% -3.16%
Inception Date: 4/14/1998 7/1/2019
Expense Ratio: 0.99% 0.87%
Total Net Assets: $705.85 Million  (3/31/24)
Morningstar Category: Small Cap Growth
Benchmark Index: Russell 2000 Growth
Related Material:
   Fund Fact Sheet Q1 2024
   PM Commentary Q4 2023
   Portfolio Manager Q&A

FINDING PREMIER GROWTH COMPANIES


Portfolio Manager Bob Male discusses the foundation for the Buffalo Small Cap Fund investment strategy – finding companies that are rapidly growing and can benefit from long term trends.

|

An actively-managed portfolio of smaller-capitalization, rapidly-growing companies that can benefit from positive, long-term trends remains an excellent way to exploit an inefficient market.

Bob Male, Portfolio Manager

Listen to the Portfolio Managers discuss their Investment Philosophy

Morningstar Rating


Overall Morningstar Rating™ of BUFSX based on risk-adjusted returns among 552 Small Growth funds as of 3/31/24.

Investment Style
Fund Objective & Investment Philosophy

The investment objective of the Buffalo Small Cap Fund is long-term growth of capital. The Small Cap Fund normally invests at least 80% of its net assets in equity securities, consisting of common stocks, preferred stocks, convertible preferred stocks, warrants and rights of small capitalization (“small-cap”) companies. The Small Cap Fund defines small-cap companies as those that, at the time of purchase, have market capitalizations within the range of the Russell 2000 Growth Index.

The Fund managers seek to identify companies for the Fund’s portfolio that are expected to experience growth based on the identification of long-term, measurable secular trends, and which, as a result, the managers believe may have potential revenue growth in excess of the gross domestic product growth rate. Companies are screened using in-depth, in-house research to identify those which the managers believe have attractive valuation, strong management, conservative debt, free cash flow, scalable business models, and competitive advantages.

Recent Recognition
Featured Articles & Reports
w

BARRON'S

i

KANSAS CITY BUSINESS JOURNAL

i

FINANCIAL ADVISOR MAGAZINE

Performance (%)

As of 3/31/243 MOYTD1 YR3 YR5 YR10 YR15 YR20 YRSince Inception
BUFFALO SMALL CAP FUND - Investor4.324.323.88-8.769.228.3412.358.5911.12
BUFFALO SMALL CAP FUND - Institutional4.364.364.07-8.639.378.4912.518.7511.29
  Russell 2000 Growth Index7.587.5820.35-2.687.387.8913.398.386.36
  Lipper Small Cap Growth Fund Index7.757.7519.70-0.209.479.4013.968.627.53

Year2013201420152016201720182019202020212022
BUFFALO SMALL CAP FUND - Investor44.15-6.55-4.466.2227.07-5.7840.9766.364.85-30.01
BUFFALO SMALL CAP FUND - Institutional44.36-6.41-4.326.3727.26-5.6441.1766.604.97-29.88
  Russell 2000 Growth Index43.305.60-1.3811.3222.17-9.3128.4834.632.83-26.36
  Morningstar U.S. Small Growth Index41.862.46-0.189.6123.77-5.6727.6043.52-1.00-33.31
For performance prior to 7/1/19 (Inception Date of Institutional Class), performance of the Investor Class shares is used and includes expenses not applicable and lower than those of Investor Class shares.Performance data quoted represents past performance; past performance does not guarantee future results. The investment return and principal value of an investment will fluctuate so that an investor’s shares, when redeemed, may be worth more or less than their original cost. Current performance of the fund may be lower of higher than the performance quoted and can be obtained here. Performance is annualized for periods greater than 1 year. Each Morningstar category average represents a universe of funds with similar objectives.
3 Year Risk Metrics
BUFSX vs Russell 2000 Growth Index (As of 3/31/24)
Upside Capture86.05
Downside Capture106.31
Alpha-5.97
Beta1.02
Sharpe Ratio-0.49
Hypothetical Growth of $10,000
This chart illustrates the performance of a hypothetical $10,000 investment made in the Fund on the Inception Date. Assumes reinvestment of dividends and capital gains. This chart does not imply future performance.

Portfolio

Portfolio Characteristics
(As of 3/31/24) 
 
# of Holdings72
Median Market Cap$3.24 B
Weighted Average Market Cap$4.50 B
3-Yr Annualized Turnover Ratio43.99%
% of Holdings with Free Cash Flow70.83%
Active Share91.41%
Top 10 Holdings
Name of HoldingTickerSector% of Net
Assets
DoubleVerify Holdings, Inc.DVInformation Technology2.86
Summit Materials, Inc. Class ASUMMaterials2.54
PGT Innovations, Inc.PGTIIndustrials2.50
Hamilton Lane Incorporated Class AHLNEFinancials2.46
Endava Plc Sponsored ADR Class ADAVAInformation Technology2.27
ICF International, Inc.ICFIIndustrials2.24
MGP Ingredients, Inc.MGPIConsumer Staples2.21
AZEK Co., Inc. Class AAZEKIndustrials2.11
Calix, Inc.CALXInformation Technology2.05
Shift4 Payments, Inc. Class AFOURFinancials2.04
TOP 10 HOLDINGS TOTAL23.26%
As of 12/31/23. Top 10 Holdings for the quarter are not disclosed until 60 days after quarter end. Fund holdings are subject to change and are not recommendations to buy or sell any securities.
Sector Weighting

As of 3/31/24. Security weightings are subject to change and are not recommendations to buy or sell any securities. Sector Allocation may not equal 100% due to rounding.

Market Capitalization

As of 3/31/24. Market Cap percentages may not equal 100% due to rounding.

Management

Bob Male, CFA
Portfolio Manager

37 Years of Experience

 View full bio

Craig Richard, CFA
Portfolio Manager

21 Years of Experience

 View full bio

Commentary

PERFORMANCE COMMENTARY

(As of 12/31/23)

The Buffalo Small Cap Fund produced a return of 7.79% for the quarter, a result
that trailed the Russell 2000 Growth Index return of 12.75%. Weak stock selection
within the Health Care sector which represented 20.4% of the index weighting was
responsible for most of the relative underperformance. Helping offset a portion
of underperformance was positive stock selection within both the Financials and
Materials sectors.

 Top Contributors
The fund’s largest contributors to performance for the quarter was PGT Innovations
and DoubleVerify. PGT Innovations is a leading manufacturer of residential impact
resistant windows and doors. The company entered into an agreement to be acquired
by Masonite International Corp causing the shares to move higher on the proposed
announced acquisition. DoubleVerify provides digital advertisers with measurement
and analytics services to ensure advertisers reach their intended audience in the right
setting. The company reported strong earnings with results ahead of expectations led
by growth in brand suitability solutions (ensuring advertisements appear alongside
non-controversial content) while also beginning to gain more traction in international
markets. We are confident in the long-term fundamentals of the company and the stock
remains one of the fund’s largest investment holdings.

Top Detractors
The fund’s largest detractors from performance in the quarter were Establishment
Labs and Chart Industries. Establishment Labs is a medical device company focused
on bringing safer breast implants to the breast augmentation and reconstruction
marketplaces. A softer consumer spending outlook in many of the company’s
international geographies caused a pause in growth and resulted in disappointing results
for the second half of 2023. We remain optimistic on the long-term growth opportunity
for the company as it is on the cusp of entering both the U.S. and Chinese markets which
should effectively double its current market opportunity. Meanwhile, Chart Industries,
which manufactures highly engineered equipment for the industrial gas, energy, and biomedical industries reported third quarter results that missed expectations due to
supply chain issues and customer delays. However, orders and backlog were strong in
the quarter and guidance for 2024 was positive. Additionally, assets sales announced
in the quarter came in ahead of schedule. We remain positive about the long-term
fundamentals of the company and believe the stock is attractively valued at current levels.

OUTLOOK

(As of 12/31/23)

While the employment environment remains strong, excess household savings
accumulated during the pandemic are being exhausted. In the fourth quarter, the
Fed signaled a more dovish position and paused its aggressive interest rate hikes
as inflation began to moderate and approached its 2% target. As a result, small cap
stocks experienced a sharp rebound in the fourth quarter with the Russell 2000
Growth Index advancing 12.75% and the Russell Microcap Index surging 16.06% with
lower market cap stocks and non-earners as the biggest drivers of performance.
As the economy slows and the Fed moves from a position of raising interest rates to
lowering rates and halts quantitative tightening, we are becoming increasingly more
positive on the outlook for small cap stocks. Valuation levels of small caps relative
to large caps remain at historically attractive levels. Additionally, the performance
gap between small cap stocks and large cap stocks remains wide relative to
historical levels, and we believe this performance gap will compress. This creates an
environment ripe for investment in small cap companies that demonstrate durable
growth. We continue to seek high quality companies that meet our investment
criteria including strong management teams, consistent free cash flow generation,
scalable business models, and sustainable competitive advantages. We believe that
such companies are well-positioned to weather economic headwinds and deliver
sustainable returns with manageable levels of risk. During the fourth quarter we added
three new investments to the fund, exited seven positions, and ended the year with 72
holdings. Thank you for your continued trust and interest in the fund.

The opinions expressed are those of the Portfolio Manager(s) and are subject to change, are not guaranteed and should not be considered recommendations to buy or sell any security. Earnings growth is not representative of the fund’s future performance.

Literature

General Account
Forms
Investor
Class
Institutional
Class
Both
  New Account Application
  New Account Application - Entity
  Change or Add Account Details
  Cost Basis Method Election
  Power of Attorney
Individual Retirement Account (IRA) Forms
  IRA Account Application
  IRA Beneficiary Addition / Change
  IRA Required Minimum Distribution (RMD)
  IRA / Qualified Plan Distribution Request
  IRA Transfer
Coverdell Education Savings Accounts (ESA) Forms
  Coverdell ESA Application
  Coverdell ESA Distribution Request
  Coverdell ESA Transfer
Retirement Information
  Retirement Savings Options for Individuals

Fundamental Approach

We get to know the companies we invest in and learn how they run their business.

Top-Down & Bottom-Up

We identify Top-Down broad, secular growth trends and search for companies from the Bottom-Up.

Proprietary Philosophy

We construct our portfolios based on our own proprietary investment strategy.

Disciplined Investing

Sticking to our disciplined investment strategy ensures we maintain a consistent, balanced approach.

The Morningstar Rating™ for funds, or "star rating", is calculated for managed products (including mutual funds, variable annuity and variable life subaccounts, exchange-traded funds, closed-end funds, and separate accounts) with at least a three-year history. Exchange-traded funds and open-ended mutual funds are considered a single population for comparative purposes. It is calculated based on a Morningstar Risk-Adjusted Return measure that accounts for variation in a managed product's monthly excess performance, placing more emphasis on downward variations and rewarding consistent performance. The top 10% of products in each product category receive 5 stars, the next 22.5% receive 4 stars, the next 35% receive 3 stars, the next 22.5% receive 2 stars, and the bottom 10% receive 1 star. The Overall Morningstar Rating™ for a managed product is derived from a weighted average of the performance figures associated with its three-, five-, and 10-year (if applicable) Morningstar Rating™ metrics. The weights are: 100% three-year rating for 36-59 months of total returns, 60% five-year rating/40% three-year rating for 60-119 months of total returns, and 50% 10-year rating/30% five-year rating/20% three-year rating for 120 or more months of total returns. While the 10-year overall star rating formula seems to give the most weight to the 10-year period, the most recent three-year period actually has the greatest impact because it is included in all three rating periods.

The Buffalo Small Cap Fund (BUFSX) received 2 stars among 552 for the 3-year, 3 stars among 520 for the 5-year, and 2 stars among 400 Small Growth funds for the 10-year period ending 3/31/24, based on risk-adjusted returns.

Diversification does not assure a profit, nor does it protect against a loss in a declining market.

Active investing has higher management fees because of the manager’s increased level of involvement while passive investing has lower management and operating fees. Investing in both actively and passively managed mutual funds involves risk and principal loss is possible. Both actively and passively managed mutual funds generally have daily liquidity. There are no guarantees regarding the performance of actively and passively managed mutual funds. Actively managed mutual funds may have higher portfolio turnover than passively managed funds. Excessive turnover can limit returns and can incur capital gains.