
Flexible Income Fund
Flexible Income Fund
Quick Facts
| Investor | Institutional | |
| Ticker: | BUFBX | BUIBX |
| Daily Pricing: | ||
| As of 4/25/2024 | ||
| NAV: | $20.46 | $20.46 |
| $ Change: | $-0.11 | $-0.11 |
| % Change: |
-0.53% | -0.53% |
| YTD: |
7.93% | 8.04% |
| Inception Date: | 8/12/1994 | 7/1/2019 |
| Expense Ratio: | 1.01% | 0.86% |
| Total Net Assets: | $489.40 Million (3/31/24) | |
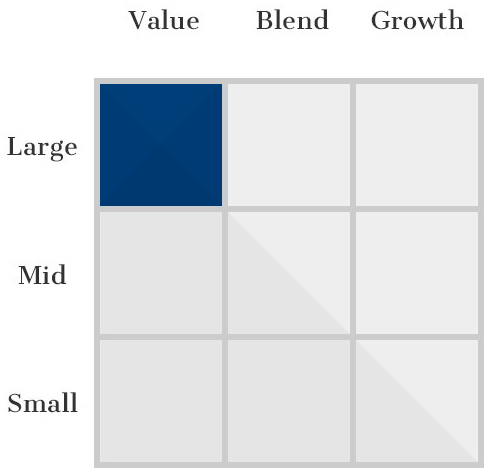
| Morningstar Category: | Large Value | |
| Benchmark Index: | Russell 3000 | |
| Dividend Distribution: | Monthly | |
|
Related Material: Fund Fact Sheet Q1 2024 PM Commentary Q4 2023 |
||
Fund Objective & Investment Process
The investment objective of the Buffalo Flexible Income Fund is primarily the generation of high current income and, as a secondary objective, the long-term growth of capital. To pursue its investment objectives, the Flexible Income Fund invests in both debt and equity securities.
The allocation of assets invested in each type of security is designed to balance income and long-term capital appreciation with reduced volatility of returns. The Flexible Income Fund expects to change its allocation mix over time based on the Fund managers’ view of economic conditions and underlying security values.
The Fund maintains a flexible investment policy which allows it to invest in debt securities with varying maturities. However, it is anticipated that the dollar-weighted average maturity of debt securities that the Fund purchases will not exceed 15 years.
▼John Kornitzer, Portfolio Manager
Morningstar Rating


Overall Morningstar Rating™ of BUFBX based on risk-adjusted returns among 1,118 Large Value funds as of 3/31/24.
Investment Style
Performance (%)
| As of 3/31/24 | 3 MO | YTD | 1 YR | 3 YR | 5 YR | 10 YR | 15 YR | 20 YR | Since Inception |
|---|---|---|---|---|---|---|---|---|---|
| BUFFALO FLEXIBLE INCOME FUND - Investor | 10.05 | 10.05 | 19.37 | 13.58 | 10.66 | 7.99 | 10.77 | 8.06 | 7.79 |
| BUFFALO FLEXIBLE INCOME FUND - Institutional | 10.15 | 10.15 | 19.61 | 13.74 | 10.83 | 8.15 | 10.94 | 8.22 | 7.95 |
| Russell 3000 Index | 10.02 | 10.02 | 29.29 | 9.78 | 14.34 | 12.33 | 15.44 | 10.07 | 10.53 |
| Lipper Mixed-Asset Target Allocation Moderate Funds Index | 5.08 | 5.08 | 14.51 | 3.85 | 7.20 | 6.16 | 8.69 | 5.96 | 6.90 |
| 2013 | 2014 | 2015 | 2016 | 2017 | 2018 | 2019 | 2020 | 2021 | 2022 | |
|---|---|---|---|---|---|---|---|---|---|---|
| BUFFALO FLEXIBLE INCOME FUND - Investor | 16.68 | 3.59 | -1.97 | 9.90 | 13.21 | -7.00 | 18.76 | -2.24 | 30.00 | 4.01 |
| BUFFALO FLEXIBLE INCOME FUND - Institutional | 16.85 | 3.75 | -1.83 | 10.07 | 13.38 | -6.86 | 18.87 | -2.10 | 30.21 | 4.22 |
| Russell 3000 Index | 33.55 | 12.56 | 0.48 | 12.74 | 21.13 | -5.24 | 31.02 | 20.89 | 25.66 | -19.21 |
| Morningstar Moderately Aggressive Target Risk Index | 20.18 | 4.97 | -2.40 | 10.21 | 18.89 | -6.74 | 22.95 | 13.51 | 14.04 | -15.48 |
Hypothetical Growth of $10,000
Distributions
Record 5/17/2024 Payable 5/20/2024
Record 6/17/2024 Payable 6/18/2024
Record 7/17/2024 Payable 7/18/2024
Record 8/19/2024 Payable 8/20/2024
Record 9/17/2024 Payable 9/18/2024
Record 10/17/2024 Payable 10/18/2024
Record 11/18/2024 Payable 11/19/2024
Record 12/4/2024 Payable 12/5/2024 Cap Gains (if any)
Record 12/17/2024 Payable 12/18/2024
| Record Date | Payable Date | Distribution NAV | Net Investment Income | Short-Term Capital Gains | Long-Term Capital Gains | Distribution Total |
|---|---|---|---|---|---|---|
| 4/17/2024 | 4/18/2024 | $20.15(Inv) $20.14 (Inst) | 0.00702538 0.00958157 | - - | - - | 0.00702538 0.00958157 |
| 3/18/2024 | 3/19/2024 | $20.52(Inv) $20.51 (Inst) | 0.00271906 0.00495243 | - - | - - | 0.00271906 0.00495243 |
| 2/20/2024 | 2/21/2024 | $19.85(Inv) $19.85 (Inst) | 0.01198410 0.01472364 | - - | - - | 0.01198410 0.01472364 |
| 1/17/2024 | 1/18/2024 | $19.02 (Inv) $19.02 (Inst) | 0.02220238 0.02456864 | - - | - - | 0.02220238 0.02456864 |
Portfolio
Portfolio Characteristics
| (As of 3/31/24) | |
|---|---|
| # of Holdings | 45 |
| Median Market Cap | $85.64 B |
| Weighted Average Market Cap | $485.11 B |
| 3-Yr Annualized Turnover Ratio | 2.17% |
| 30-day SEC Yield | 1.66% |
Top 10 Holdings
| Holding | Ticker / Maturity | Sector | % of Net Assets |
|---|---|---|---|
| Microsoft Corporation | MSFT | Information Technology | 9.39 |
| Eli Lilly and Company | LLY | Health Care | 5.06 |
| Hess Corporation | HES | Energy | 4.54 |
| Costco Wholesale Corporation | COST | Consumer Staples | 4.30 |
| ConocoPhillips | COP | Energy | 4.16 |
| Chevron Corporation | CVX | Energy | 4.05 |
| Exxon Mobil Corporation | XOM | Energy | 3.58 |
| Arthur J. Gallagher & Co. | AJG | Financials | 3.42 |
| APA Corporation | APA | Energy | 3.12 |
| PepsiCo, Inc. | PEP | Consumer Staples | 2.95 |
| TOP 10 HOLDINGS TOTAL | 44.56% | ||
Sector Weighting
As of 3/31/24. Security weightings are subject to change and are not recommendations to buy or sell any securities. Sector Allocation may not equal 100% due to rounding.
Asset Allocation
As of 3/31/24. Allocation percentages may not equal 100% due to rounding.
Management


Commentary
PERFORMANCE COMMENTARY
(As of 12/31/23) —
The Buffalo Flexible Income Fund produced a return of 5.26% compared to
the primary prospectus benchmark, Russell 3000 Index, return of 12.07%. The
energy sector was primarily responsible for the underperformance relative to the
benchmark. The fund was overweight the worst performing sector of the market
during the quarter. Specific energy companies in the portfolio that contributed to the
underperformance included Exxon, Chevron, APA, Hess and Schlumberger. Share
prices for all of these were down between 5%-14% during the quarter. The primary
driver behind the decline in the energy valuations was the decline in oil prices, which
fell from roughly $85 at the end of September to roughly $71 at year-end. Accordingly,
the stock price of energy companies fell, as their near-term profits are likely to
contract despite no adverse material stock specific information related to any of these
companies during the quarter.
Top Contributors
The top three contributors to the fund during the quarter were Microsoft, Qualcomm
and Allstate. Microsoft reported strong earnings results driven by continued growth in
Office and Azure. Additionally, the company’s guidance was better than expected and
was driven by continued positive business momentum. Qualcomm reported better
than expected earnings and provided better than expected guidance. Additionally, the
company indicated that handset channel inventory levels were back to more normalized
levels. Meanwhile, Allstate benefitted from a strong pricing environment as well as lower
loss ratios.
OUTLOOK
(As of 12/31/23) —
The economy is slowing to a more sustainable level of growth as consumers have
spent much of the excess savings accumulated during the pandemic. With demand
moderating and the job market beginning to loosen, we believe inflationary pressures
will continue to moderate. The Fed’s aggressive tightening cycle appears to be getting
the job done on inflation, and a disaster scenario of stubbornly high inflation coupled
with a consumer-led recession appears to be off the table. Moreover, the Fed now has
firepower to stimulate when needed.
Following the sharp rally to close out 2023, the market seems likely to consolidate its
gains in the near term. Numerous forward-looking indicators suggest the economy will
soften in 2024, including an inverted Treasury yield curve, a decline in the Conference
Board Leading Economic Index, and the National Federation of Independent
Businesses’ (NFIB) hiring plans survey. And while the Fed can cut short-term interest
rates to stimulate demand, we do not expect another round of stimulus checks given
the Federal government is already running an unsustainable $2 trillion annual deficit.
Against this backdrop, expect management teams to offer cautious forward-looking
guidance.
We remain focused on wide moat, large capitalization dividend-paying companies
trading at reasonable valuations, in our view. As always, the fund will continue to
emphasize competitively advantaged companies that can be purchased at a fair value.
We will be ready to take advantage of opportunities created by stock market volatility
using market declines as attractive entry points for long-term investors.
Literature
| Buffalo Flexible Income Fund Documents | Last Updated |
|---|---|
| Fact Sheet | 3/31/24 |
| Quarterly Commentary | 12/31/23 |
| Full Fund Holdings | 6/30/23 |
| Prospectus | 7/28/23 |
| Statement of Additional Information | 7/28/23 |
| Annual Report | 3/31/23 |
| Semi-Annual Report | 9/30/22 |
| Tax Guide - 2023 | 1/8/24 |
Fundamental Approach
We get to know the companies we invest in and learn how they run their business.
Top-Down & Bottom-Up
We identify Top-Down broad, secular growth trends and search for companies from the Bottom-Up.
Proprietary Philosophy
We construct our portfolios based on our own proprietary investment strategy.
Disciplined Investing
Sticking to our disciplined investment strategy ensures we maintain a consistent, balanced approach.
The Morningstar Rating™ for funds, or "star rating", is calculated for managed products (including mutual funds, variable annuity and variable life subaccounts, exchange-traded funds, closed-end funds, and separate accounts) with at least a three-year history. Exchange-traded funds and open-ended mutual funds are considered a single population for comparative purposes. It is calculated based on a Morningstar Risk-Adjusted Return measure that accounts for variation in a managed product's monthly excess performance, placing more emphasis on downward variations and rewarding consistent performance. The top 10% of products in each product category receive 5 stars, the next 22.5% receive 4 stars, the next 35% receive 3 stars, the next 22.5% receive 2 stars, and the bottom 10% receive 1 star. The Overall Morningstar Rating™ for a managed product is derived from a weighted average of the performance figures associated with its three-, five-, and 10-year (if applicable) Morningstar Rating™ metrics. The weights are: 100% three-year rating for 36-59 months of total returns, 60% five-year rating/40% three-year rating for 60-119 months of total returns, and 50% 10-year rating/30% five-year rating/20% three-year rating for 120 or more months of total returns. While the 10-year overall star rating formula seems to give the most weight to the 10-year period, the most recent three-year period actually has the greatest impact because it is included in all three rating periods.
The Buffalo Flexible Income Fund (BUFBX) received 5 stars among 1118 for the 3-year, 3 stars among 1058 for the 5-year, and 3 stars among 816 Large Value funds for the 10-year period ending 3/31/24.