Mid Cap Discovery Fund

Mid Cap Discovery Fund

Quick Facts
Investor Institutional
Ticker: BUFTX BUITX
Daily Pricing:  
As of 9/26/2024  
NAV: $25.34 $25.57
$ Change: $0.20 $0.21
% Change:
0.80% 0.83%
YTD:
5.63% 5.70%
Inception Date: 4/16/2001 7/1/2019
Expense Ratio: 1.01% 0.86%
Total Net Assets: $729.19 Million  (6/30/24)
Morningstar Category: Mid Cap Growth
Benchmark Index: Russell Midcap Growth
Related Material:
   Fund Fact Sheet Q2 2024
   PM Commentary Q2 2024
   Portfolio Manager Q&A
FUND OBJECTIVE & INVESTMENT PHILOSOPHY

The investment objective of the Buffalo Mid Cap Discovery Fund is long-term growth of capital.

The Fund managers seek to identify companies expected to benefit from innovation and experience growth based on the identification of long-term, measurable secular trends, and which, as a result, the managers believe may have potential revenue growth in excess of the gross domestic product growth rate.

Companies engaged in innovative strategies are those who, in the Fund managers’ opinion, are engaged in the pursuit and practical application of knowledge to discover, develop, and commercialize products, services, or intellectual property.

Companies are screened using in-depth, in-house research to identify those which the Fund managers believe have favorable attributes, including attractive valuation, strong management, conservative debt, free cash flow, scalable business models, and competitive advantages.

|

To us, innovation means to discover and transform new ideas into meaningful commercial value. The greater the economic impact and the longer the staying power, the better.

We seek under-appreciated stock opportunities in companies where thoughtful management teams are in a favorable position to use innovation for market advantage and sustained shareholder value creation.

Dave Carlsen, CFA, Portfolio Manager

Morningstar Ratings


Overall Morningstar Rating™ of BUFTX based on risk-adjusted returns among 510 Midcap Growth funds as of 8/31/24.

Performance (%)

As of 8/31/243 MOYTD1 YR3 YR5 YR10 YR15 YR20 YRSince Inception
BUFFALO MID CAP DISCOVERY FUND -
Investor
6.074.9613.47-2.307.519.4112.5610.699.10
BUFFALO MID CAP DISCOVERY FUND -
Institutional
6.105.0413.64-2.167.679.5712.7310.869.26
  Russell Midcap Growth Index4.839.2719.07-0.4610.5010.6113.3810.799.36
As of 6/30/243 MOYTD1 YR3 YR5 YR10 YR15 YR20 YRSince Inception
BUFFALO MID CAP DISCOVERY FUND -
Investor
-5.570.388.18-2.776.668.9413.029.848.96
BUFFALO MID CAP DISCOVERY FUND -
Institutional
-5.560.418.29-2.636.819.1013.1810.009.12
  Russell Midcap Growth Index-3.215.9815.05-0.089.9310.5113.9510.179.29
 
20132014201520162017201820192020202120222023
BUFFALO MID CAP DISCOVERY FUND - Investor36.6110.685.645.5625.44-6.5431.6333.8111.90-28.6724.30
BUFFALO MID CAP DISCOVERY FUND - Institutional36.8210.855.805.7225.62-6.4031.8234.0312.07-28.5724.50
  Russell Midcap Growth Index35.7411.90-0.207.3325.27-4.7535.4735.5912.73-26.7225.87
For performance prior to 7/1/19 (Inception Date of Institutional Class), performance of the Investor Class shares is used and includes expenses not applicable and lower than those of Investor Class shares. Performance data quoted represents past performance; past performance does not guarantee future results. The investment return and principal value of an investment will fluctuate so that an investor’s shares, when redeemed, may be worth more or less than their original cost. Current performance of the fund may be lower of higher than the performance quoted and can be obtained here. Performance is annualized for periods greater than 1 year. Each Morningstar category average represents a universe of funds with similar objectives.
3 Year Risk Metrics
BUFTX vs Russell Midcap Growth Index (As of 6/30/24)
Upside Capture100.68
Downside Capture105.74
Alpha-2.59
Beta1.00
Sharpe Ratio-0.27
Hypothetical Growth of $10,000
 

This chart illustrates the performance of a hypothetical $10,000 investment made in the Fund on the Inception Date. Assumes reinvestment of dividends and capital gains. This chart does not imply future performance.

Portfolio

Portfolio Characteristics
(As of 6/30/24) 
 
# of Holdings82
Median Market Cap$28.73 B
Weighted Average Market Cap$34.98 B
3-Yr Annualized Turnover Ratio37.96%
% of Holdings with Free Cash Flow92.68%
Active Share78.55%
Top 10 Holdings
HoldingTickerSector% of Net
Assets
MSCI Inc.MSCIFinancials3.15
IQVIA Holdings IncIQVHealth Care2.99
CoStar Group, Inc.CSGPIndustrials2.30
TransUnionTRUIndustrials2.26
Ingersoll Rand Inc.IRIndustrials2.21
AMETEK, Inc.AMEIndustrials2.11
DoubleVerify Holdings, Inc.DVInformation Technology2.08
Copart, Inc.CPRTIndustrials2.00
Martin Marietta Materials, Inc.MLMMaterials1.98
Aptiv PLCAPTVConsumer Discretionary1.96
TOP 10 HOLDINGS TOTAL23.03%
As of 3/31/24. Top 10 Holdings for the quarter are not disclosed until 60 days after quarter end. Fund holdings are subject to change and are not recommendations to buy or sell any securities.
Sector Weighting

As of 6/30/24. Security weightings are subject to change and are not recommendations to buy or sell any securities. Sector Allocation may not equal 100% due to rounding.

Market Capitalization

As of 6/30/24. Market Cap percentages may not equal 100% due to rounding.

Management

Dave Carlsen, CFA
Portfolio Manager

31 Years of Experience

 View full bio

Josh West, CFA
Portfolio Manager

18 Years of Experience

 View full bio

Doug Cartwright, CFA
Portfolio Manager

17 Years of Experience

 View full bio

Commentary

The opinions expressed are those of the Portfolio Manager(s) and are subject to change, are not guaranteed and should not be considered recommendations to buy or sell any security. Investing in both actively and passively managed mutual funds involves risk and principal loss is possible. Earnings growth is not representative of the fund’s future performance.

Literature

Buffalo Mid Cap Discovery Fund
Documents
Last
Updated
  Fact Sheet6/30/24
  Quarterly Commentary6/30/24
  Full Fund Holdings3/31/24
  Prospectus7/29/24
  Statement of Additional Information7/29/24
  Annual Report3/31/24
  Semi-Annual Report9/30/23
  Tax Guide - 20231/8/24
General Account
Forms
Investor
Class
Institutional
Class
Both
  New Account Application
  New Account Application - Entity
  Change or Add Account Details
  Cost Basis Method Election
  Power of Attorney
Individual Retirement Account (IRA) Forms
  IRA Account Application
  IRA Beneficiary Addition / Change
  IRA Required Minimum Distribution (RMD)
  IRA / Qualified Plan Distribution Request
  IRA Transfer
Coverdell Education Savings Accounts (ESA) Forms
  Coverdell ESA Application
  Coverdell ESA Distribution Request
  Coverdell ESA Transfer
Retirement Information
  Retirement Savings Options for Individuals

Fundamental Approach

We get to know the companies we invest in and learn how they run their business.

Top-Down & Bottom-Up

We identify Top-Down broad, secular growth trends and search for companies from the Bottom-Up.

Proprietary Philosophy

We construct our portfolios based on our own proprietary investment strategy.

Disciplined Investing

Sticking to our disciplined investment strategy ensures we maintain a consistent, balanced approach.

Morningstar Rating™

The Morningstar Rating™ for funds, or "star rating", is calculated for managed products (including mutual funds, variable annuity and variable life subaccounts, exchange-traded funds, closed-end funds, and separate accounts) with at least a three-year history. Exchange-traded funds and open-ended mutual funds are considered a single population for comparative purposes. It is calculated based on a Morningstar Risk-Adjusted Return measure that accounts for variation in a managed product's monthly excess performance, placing more emphasis on downward variations and rewarding consistent performance. The Morningstar Rating does not include any adjustment for sales loads. The top 10% of products in each product category receive 5 stars, the next 22.5% receive 4 stars, the next 35% receive 3 stars, the next 22.5% receive 2 stars, and the bottom 10% receive 1 star. The Overall Morningstar Rating™ for a managed product is derived from a weighted average of the performance figures associated with its three-, five-, and 10-year (if applicable) Morningstar Rating™ metrics. The weights are: 100% three-year rating for 36-59 months of total returns, 60% five-year rating/40% three-year rating for 60-119 months of total returns, and 50% 10-year rating/30% five-year rating/20% three-year rating for 120 or more months of total returns. While the 10-year overall star rating formula seems to give the most weight to the 10-year period, the most recent three-year period actually has the greatest impact because it is included in all three rating periods.

©2024 Morningstar, Inc. All Rights Reserved. The information contained herein: (1) is proprietary to Morningstar; (2) may not be copied or distributed; and (3) is not warranted to be accurate, complete or timely. Neither Morningstar nor its content providers are responsible for any damages or losses arising from any use of this information. Past performance is no guarantee of future results.

The Buffalo Mid Cap Discovery Fund (BUFTX) received 3 stars among 510 for the 3-year, 2 stars among 477 for the 5-year, and 3 stars among 379 Mid-Cap Growth funds for the 10-year period ending 8/31/24. Other share classes may have different performance characteristics.

Growth & Income Fund

Growth & Income Fund

Quick Facts
Investor Institutional
Ticker: BUFDX BUIDX
Daily Pricing:  
As of 9/26/2024  
NAV: $31.55 $31.56
$ Change: $-0.03 $-0.03
% Change:
-0.09% -0.09%
YTD:
16.76% 16.92%
Inception Date: 12/3/2012 7/1/2019
Expense Ratio: 0.95% 0.80%
Total Net Assets: $162.97 Million  (6/30/24)
Morningstar Category: Large Cap Blend
Benchmark Index: Russell 1000
Dividend Distribution: Quarterly
Related Material:
   Fund Fact Sheet Q2 2024
   PM Commentary Q2 2024
   Portfolio Manager Q&A
FUND OBJECTIVE & INVESTMENT PROCESS

The investment objective of the Buffalo Growth & Income Fund is primarily current income, with long-term growth of capital as a secondary objective.

To pursue its investment objective, the Fund invests in dividend-paying equity securities, consisting of domestic common stocks, preferred stocks, and convertible securities. During normal market conditions, at least 80% of the Fund’s assets will be invested in dividend-paying equity securities, companies that declare and pay cash dividends on at least an annual basis.

While the Fund may invest in securities of companies of any size, the Fund managers expect the majority of common stocks purchased will be of large-cap companies, those with market capitalizations in excess of $10 billion at the time of initial purchase.

|

We are focused on buying dividend-paying companies that can have sustainable competitive advantages, generate strong return on capital and free cash flow, have conservative balance sheets, and have great management teams.

We seek to buy these companies at reasonable valuations and believe that holding them for the long-term will generate favorable risk adjusted returns.

Paul Dlugosch, Portfolio Manager

Morningstar Rating


Overall Morningstar Rating™ of BUFDX based on risk-adjusted returns among 1,292 Large Blend funds as of 8/31/24.

Performance (%)

As of 8/31/243 MOYTD1 YR3 YR5 YR10 YRSince Inception
BUFFALO GROWTH & INCOME FUND - Investor6.2816.1324.669.7714.4611.7313.27
BUFFALO GROWTH & INCOME FUND - Institutional6.2816.2424.799.9114.6111.8913.43
  Russell 1000 Index7.3018.6426.608.3415.5512.6614.48
  S&P 500 Index7.3919.5327.149.3815.9212.9814.69
As of 6/30/243 MOYTD1 YR3 YR5 YR10 YRSince Inception
BUFFALO GROWTH & INCOME FUND - Investor-0.139.7819.608.8213.4211.3612.92
BUFFALO GROWTH & INCOME FUND - Institutional-0.069.8919.778.9913.5911.5313.09
  Russell 1000 Index3.5714.2423.888.7414.6112.5114.33
  S&P 500 Index4.2815.2924.5610.0115.0512.8614.56

20132014201520162017201820192020202120222023
BUFFALO GROWTH & INCOME FUND - Investor23.9320.810.1312.0618.02-5.0527.6616.6420.97-8.7520.06
BUFFALO GROWTH & INCOME FUND - Institutional24.1220.980.2812.2318.20-4.9127.8516.8321.15-8.6220.21
  Russell 1000 Index33.1113.240.9212.0521.69-4.7831.4320.9626.45-19.1326.53
For performance prior to 7/1/19 (Inception Date of Institutional Class), performance of the Investor Class shares is used and includes expenses not applicable and lower than those of Investor Class shares.Performance data quoted represents past performance; past performance does not guarantee future results. The investment return and principal value of an investment will fluctuate so that an investor’s shares, when redeemed, may be worth more or less than their original cost. Current performance of the fund may be lower of higher than the performance quoted and can be obtained here. Performance is annualized for periods greater than 1 year. Each Morningstar category average represents a universe of funds with similar objectives.
3 Year Risk Metrics
BUFDX vs Russell 1000 Index (As of 6/30/24)
Upside Capture73.22
Downside Capture79.92
Alpha1.67
Beta0.79
Sharpe Ratio0.39
Hypothetical Growth of $10,000
 
This chart illustrates the performance of a hypothetical $10,000 investment made in the Fund on the Inception Date. Assumes reinvestment of dividends and capital gains. This chart does not imply future performance.
Distributions
2024 Projected Distribution Dates:

Record 12/4/2024 Payable 12/5/2024 Cap Gains (if any)

Record 12/17/2024 Payable 12/18/2024

Record
Date
Payable
Date
Distribution
NAV
Net Investment
Income
Short-Term Capital
Gains
Long-Term Capital
Gains
Distribution
Total
9/17/249/18/24$31.28 (Inv)

$31.29 (Inst)
$0.08147743

$0.09380152
-

-
$0.08147743

$0.09380152
6/17/246/18/24$29.69 (Inv)

$29.70 (Inst)
$0.26054635

$0.27020187
-

-
$0.26054635

$0.27020187
3/18/243/19/24$29.50 (Inv)

$29.51 (Inst)
$0.05519288

$0.06513191
-

-
$0.05519288

$0.06513191
12/18/2312/19/23$27.20 (Inv)

$27.20 (Inst)
$0.15591721

$0.16483955
-

-
$0.15591721

$0.16483955
12/4/2312/5/23$26.40 (Inv)

$26.41 (Inst)
-

-
-

-
0.12045

0.12045
$0.12045

$0.12045
9/18/239/19/23$25.69 (Inv)

$25.70 (Inst)
$0.05988226

$0.06325017
-

-
-

-
$0.05988226

$0.06325017
6/20/236/21/23$24.99 (Inv)

$24.99 (Inst)
$0.13682440

$0.14679972
-

-
-

-
$0.13682440

$0.14679972
3/21/233/20/23$23.12 (Inv)

$23.12 (Inst)
$0.05969832

$0.06839440
-

-
-

-
$0.05969832

$0.06839440
12/19/2212/20/22$23.08 (Inv)

$23.08 (Inst)
$0.05908577

$0.06777300
-

-
-

-
$0.05908577

$0.06777300
12/4/2212/5/22$23.89 (Inv)

$23.90 (Inst)
-

-
-

-
$0.38214

$0.38214
$0.38214

$0.38214
9/19/229/20/22$23.27 (Inv)

$23.27 (Inst)
$0.05162443

$0.06073302
-

-
-

-
$0.05162443

$0.06073302
6/20/226/21/22$22.72 (Inv)

$22.72 (Inst)
$0.06141577

$0.06934834
-

-
-

-
$0.06141577

$0.06934834
3/19/223/18/22$25.56 (Inv)

$25.56 (Inst)
$0.05379801

$0.06334236
-

-
-

-
$0.05379801

$0.06334236
12/19/2112/20/21$25.24 (Inv)

$25.24 (Inst)
$0.02757485

$0.03722365
-

-
-

-
$0.02757485

$0.03722365
12/3/21$24.99 (Inv)

$24.99 (Inst)
-

-
$0.10327

$0.10327
$0.20964

$0.20964
$0.31291

$0.31291
9/20/21$24.79 (Inv)

$24.79 (Inst)
$0.03057741

$0.04007525
-

-
-

-
$0.03057741

$0.04007525
6/18/21$24.27 (Inv)

$24.26 (Inst)
$0.02933960

$0.03839857
-

-
-

-
$0.02933960

$0.03839857
3/18/21$23.16 (Inv)

$23.16 (Inst)
$0.05098388

$0.05942821
-

-
-

-
$0.05098388

$0.05942821
12/18/20$21.72 (Inv)

$21.72 (Inst)
$0.00905139

$0.01801390
-

-
-

-
$0.00905139

$0.01801390
9/18/20$19.13 (Inv)

$19.13 (Inst)
$0.03170945

$0.03903915
-

-
-

-
$0.03170945

$0.03903915
6/18/20$18.26 (Inv)

$18.26 (Inst)
$0.03034499

$0.03590278
-

-
-

-
$0.03034499

$0.03590278
3/18/20$14.07 (Inv)

$14.07 (Inst)
$0.03107063

$0.03831320
-

-
-

-
$0.03107063

$0.03831320
12/18/19$18.82 (Inv)

$18.82 (Inst)
$0.04196909

$0.04964262
-

-
-

-
$0.04196909

$0.04964262
9/18/19$17.80 (Inv)

$17.80 (Inst)
$0.04731858

$0.05327159
-

-
-

-
$0.04731858

$0.05327159
6/18/19$17.20$0.06566509--$0.06566509
3/19/19$16.72$0.05232873--$0.05232873
12/18/18$15.33$0.08791977$0.02500$0.51339$0.62630977
9/18/18$17.96$0.05499230--$0.05499230
6/19/18$16.99$0.05791680--$0.05791680
3/20/18$16.72$0.04369471--$0.04369471
12/19/17$16.73$0.05315489$0.15204-$0.20519489
9/19/17$15.79$0.05107348--$0.05107348
6/20/17$15.53$0.04405814--$0.04405814
3/20/17$15.37$0.04662158--$0.04662158
12/20/16$14.58$0.04502534$0.06489$0.03508$0.14499534
9/20/16$13.78$0.04538819--$0.04538819
6/20/16$13.34$0.04391608--$0.04391608
3/18/16$13.15$0.04845082--$0.04845082
12/18/15$12.88$0.04061333$0.14263$0.11942$0.30266333
9/18/15$12.94$0.03816853--$0.03816853
6/18/15$14.29$0.04120635--$0.04120635
3/18/15$13.89$0.04200730--$0.04200730
12/18/14$13.53$0.03066401$0.54808$0.10086$0.67960401
9/18/14$13.50$0.02424009--$0.02424009
6/18/14$13.05$0.03496855--$0.03496855
3/18/14$12.11$0.03702784--$0.03702784
12/18/13$11.56$0.04725764$0.38271-$0.42996764
9/18/13$11.47$0.03960545--$0.03960545
6/18/13$11.13$0.03967611--$0.03967611
3/19/13$10.36$0.01492578--$0.01492578

Portfolio

Portfolio Characteristics
(As of 6/30/24) 
 
# of Holdings97
Median Market Cap$64.40 B
Weighted Average Market Cap$604.69 B
3-Yr Annualized Turnover Ratio4.33%
% of Holdings with Free Cash Flow65.42%
30-day SEC Yield1.47%
Top 10 Holdings
HoldingTicker / MaturitySector% of Net
Assets
Microsoft CorporationMSFTInformation Technology4.79
Meta Platforms IncMETACommunication Services3.95
Viper Energy, Inc.VNOMEnergy3.52
Apple Inc.AAPLInformation Technology3.26
Visa Inc.VFinancials2.20
S&P Global, Inc.SPGIFinancials1.85
Arthur J. Gallagher & Co.AJGFinancials1.77
Burford Capital LimitedBURFinancials1.76
Royal Caribbean Group 6.0% 15-aug-2025Consumer Discretionary1.74
JPMorgan Chase & Co.JPMFinancials1.71
TOP 10 HOLDINGS TOTAL26.56%
As of 3/31/24. Top 10 Holdings for the quarter are not disclosed until 60 days after quarter end. Fund holdings are subject to change and are not recommendations to buy or sell any securities.
Sector Weighting

As of 6/30/24. Security weightings are subject to change and are not recommendations to buy or sell any securities. Sector Allocation may not equal 100% due to rounding.

Market Capitalization

As of 6/30/24. Market Cap percentages may not equal 100% due to rounding.

Management

Paul Dlugosch, CFA
Portfolio Manager

26 Years of Experience

 View full bio

Jeff Sitzmann, CFA
Portfolio Manager

36 Years of Experience

 View full bio

Jeff Deardorff, CFA
Portfolio Manager

26 Years of Experience

 View full bio

Commentary

The opinions expressed are those of the Portfolio Manager(s) and are subject to change, are not guaranteed and should not be considered recommendations to buy or sell any security. Earnings growth is not representative of the fund’s future performance.

Literature

Buffalo Growth & Income Fund
Documents
Last
Updated
  Fact Sheet6/30/24
  Quarterly Q&A6/30/24
  Full Fund Holdings3/31/24
  Prospectus7/29/24
  Statement of Additional Information7/29/24
  Annual Report3/31/24
  Semi-Annual Report9/30/23
  Tax Guide - 20231/8/24
General Account
Forms
Investor
Class
Institutional
Class
Both
  New Account Application
  New Account Application - Entity
  Change or Add Account Details
  Cost Basis Method Election
  Power of Attorney
Individual Retirement Account (IRA) Forms
  IRA Account Application
  IRA Beneficiary Addition / Change
  IRA Required Minimum Distribution (RMD)
  IRA / Qualified Plan Distribution Request
  IRA Transfer
Coverdell Education Savings Accounts (ESA) Forms
  Coverdell ESA Application
  Coverdell ESA Distribution Request
  Coverdell ESA Transfer
Retirement Information
  Retirement Savings Options for Individuals

Fundamental Approach

We get to know the companies we invest in and learn how they run their business.

Top-Down & Bottom-Up

We identify Top-Down broad, secular growth trends and search for companies from the Bottom-Up.

Proprietary Philosophy

We construct our portfolios based on our own proprietary investment strategy.

Disciplined Investing

Sticking to our disciplined investment strategy ensures we maintain a consistent, balanced approach.

The Morningstar Rating™ for funds, or "star rating", is calculated for managed products (including mutual funds, variable annuity and variable life subaccounts, exchange-traded funds, closed-end funds, and separate accounts) with at least a three-year history. Exchange-traded funds and open-ended mutual funds are considered a single population for comparative purposes. It is calculated based on a Morningstar Risk-Adjusted Return measure that accounts for variation in a managed product's monthly excess performance, placing more emphasis on downward variations and rewarding consistent performance. The top 10% of products in each product category receive 5 stars, the next 22.5% receive 4 stars, the next 35% receive 3 stars, the next 22.5% receive 2 stars, and the bottom 10% receive 1 star. The Overall Morningstar Rating™ for a managed product is derived from a weighted average of the performance figures associated with its three-, five-, and 10-year (if applicable) Morningstar Rating™ metrics. The weights are: 100% three-year rating for 36-59 months of total returns, 60% five-year rating/40% three-year rating for 60-119 months of total returns, and 50% 10-year rating/30% five-year rating/20% three-year rating for 120 or more months of total returns. While the 10-year overall star rating formula seems to give the most weight to the 10-year period, the most recent three-year period actually has the greatest impact because it is included in all three rating periods.

The Buffalo Growth & Income Fund (BUFDX) received 5 stars among 1,292 for the 3-year period, 3 stars among 1,185 for the 5-year period, and 3 stars among 893 Large Blend funds for the 10-year period ending 8/31/24.

Early Stage Growth Fund

Early Stage Growth Fund

Quick Facts
Investor Institutional
Ticker: BUFOX BUIOX
Daily Pricing:  
As of 9/26/2024  
NAV: $16.73 $16.86
$ Change: $0.15 $0.14
% Change:
0.90% 0.84%
YTD:
8.50% 8.49%
Inception Date: 5/21/2004 7/1/2019
Expense Ratio: 1.50% 1.35%
Total Net Assets: $70.90 Million  (6/30/24)
Morningstar Category: Small Cap Growth
Benchmark Index: Russell 2000 Growth
Related Material:
   Fund Fact Sheet Q2 2024
   PM Commentary Q2 2024
Fund Objective & Investment Process

The investment objective of the Buffalo Early Stage Growth Fund is long-term growth of capital. The Fund invests primarily in equity securities, consisting of common stocks, preferred stocks, convertible securities, warrants and rights, of companies that, at the time of purchase by the Fund, are defined as early stage growth companies. Early stage growth companies are defined by the Fund as companies, at the time of purchase, with market capitalizations below the weighted average of the Russell 2000 Growth Index and are starting to develop a new product or service or have recently developed a new product or service.

The Fund managers seek to identify companies for the Fund’s portfolio that are expected to experience growth based on the identification of long-term, measurable secular trends, and which, as a result, may have potential revenue growth in excess of the gross domestic product growth rate. Companies are screened using in-depth, in-house research to identify premier early-stage growth companies which generally demonstrate:

  • Strong management teams
  • Little or no debt
  • Potential for increasing free cash flow
  • Scalable business models with a competitive advantage
  • Potential for increasing margins
  • Attractive risk/reward given the market framework
|

We believe investing in an actively-managed portfolio of premier, early-stage, growth companies could lead to growth of capital over time. We look for companies that could benefit from long-term industrial, technological, or general market trends, and are trading at what we view as attractive valuations.

Craig Richard, Portfolio Manager

Morningstar Rating


Overall Morningstar Rating™ of BUFOX based on risk-adjusted returns among 547 Small Growth funds as of 8/31/24.

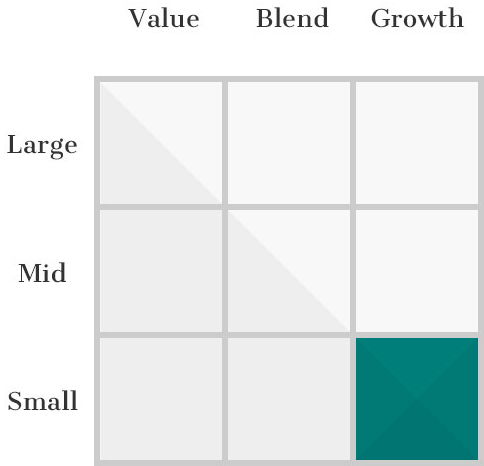
Investment Style

Performance (%)

As of 8/31/243 MOYTD1 YR3 YR5 YR10 YR15 YRSince Inception
BUFFALO EARLY STAGE GROWTH FUND - Investor5.698.509.85-8.068.068.3512.748.41
BUFFALO EARLY STAGE GROWTH FUND - Institutional5.718.499.91-7.978.208.5012.908.57
  Russell 2000 Growth Index6.8111.7417.67-2.078.358.2111.478.85
As of 6/30/243 MOYTD1 YR3 YR5 YR10 YR15 YRSince Inception
BUFFALO EARLY STAGE GROWTH FUND - Investor-3.161.49-2.13-10.375.707.2213.138.12
BUFFALO EARLY STAGE GROWTH FUND - Institutional-3.191.48-2.11-10.275.837.3713.298.28
  Russell 2000 Growth Index-2.924.449.14-4.866.177.3911.598.56

20132014201520162017201820192020202120222023
BUFFALO EARLY STAGE GROWTH FUND - Investor61.70-7.38-9.4111.0527.18-3.9534.0347.697.79-30.769.83
BUFFALO EARLY STAGE GROWTH FUND - Institutional61.94-7.24-9.2811.2227.37-3.8134.2047.967.94-30.669.98
  Russell 2000 Growth Index43.305.60-1.3811.3222.17-9.3128.4834.632.83-26.3618.66
For performance prior to 7/1/19 (Inception Date of Institutional Class), performance of the Investor Class shares is used and includes expenses not applicable and lower than those of Investor Class shares. Performance data quoted represents past performance; past performance does not guarantee future results. The investment return and principal value of an investment will fluctuate so that an investor’s shares, when redeemed, may be worth more or less than their original cost. Current performance of the fund may be lower of higher than the performance quoted and can be obtained here. Performance is annualized for periods greater than 1 year. Each Morningstar category average represents a universe of funds with similar objectives.
3 Year Risk Metrics
BUFOX vs Russell 2000 Growth Index (As of 6/30/24)
Upside Capture81.42
Downside Capture103.56
Alpha-6.08
Beta0.94
Sharpe Ratio-0.62
Hypothetical Growth of $10,000

This chart illustrates the performance of a hypothetical $10,000 investment made in the Fund on the Inception Date. Assumes reinvestment of dividends and capital gains. This chart does not imply future performance.

Portfolio

Portfolio Characteristics
(As of 6/30/24) 
 
# of Holdings58
Median Market Cap$1.49 B
Weighted Average Market Cap$3.04 B
3-Yr Annualized Turnover Ratio18.39%
% of Holdings with Free Cash Flow74.14%
Active Share94.44%
Top 10 Holdings
HoldingTickerSector% of Net
Assets
Transcat, Inc.TRNSInformation Technology3.23
Compass Diversified HoldingsCODIFinancials2.95
Willdan Group, Inc.WLDNIndustrials2.94
Hamilton Lane IncorporatedHLNEFinancials2.80
Patrick Industries, Inc.PATKConsumer Discretionary2.73
SunOpta Inc.STKLConsumer Staples2.73
Bowman Consulting Group, Ltd.BWMNIndustrials2.68
Kinsale Capital Group, Inc.KNSLFinancials2.57
Verra Mobility Corp.VRRMIndustrials2.56
CyberArk Software Ltd.CYBRInformation Technology2.41
TOP 10 HOLDINGS TOTAL27.60%
As of 3/31/24. Top 10 Holdings for the quarter are not disclosed until 60 days after quarter end. Fund holdings are subject to change and are not recommendations to buy or sell any securities.
Sector Weighting

As of 6/30/24. Security weightings are subject to change and are not recommendations to buy or sell any securities. Sector Allocation may not equal 100% due to rounding.

Market Capitalization

As of 6/30/24. Market Cap percentages may not equal 100% due to rounding.

Management

Craig Richard, CFA
Portfolio Manager

21 Years of Experience

 View full bio

Doug Cartwright, CFA
Portfolio Manager

17 Years of Experience

 View full bio

Commentary

The opinions expressed are those of the Portfolio Manager(s) and are subject to change, are not guaranteed and should not be considered recommendations to buy or sell any security. Earnings growth is not representative of the fund’s future performance.

Literature

Buffalo Early Stage Growth
Documents
Last
Updated
  Fact Sheet6/30/24
  Quarterly Commentary6/30/24
  Full Fund Holdings3/31/24
  Prospectus7/29/24
  Statement of Additional Information7/29/24
  Annual Report3/31/24
  Semi-Annual Report9/30/23
  Tax Guide - 20231/8/24
General Account
Forms
Investor
Class
Institutional
Class
Both
  New Account Application
  New Account Application - Entity
  Change or Add Account Details
  Cost Basis Method Election
  Power of Attorney
Individual Retirement Account (IRA) Forms
  IRA Account Application
  IRA Beneficiary Addition / Change
  IRA Required Minimum Distribution (RMD)
  IRA / Qualified Plan Distribution Request
  IRA Transfer
Coverdell Education Savings Accounts (ESA) Forms
  Coverdell ESA Application
  Coverdell ESA Distribution Request
  Coverdell ESA Transfer
Retirement Information
  Retirement Savings Options for Individuals

Fundamental Approach

We get to know the companies we invest in and learn how they run their business.

Top-Down & Bottom-Up

We identify Top-Down broad, secular growth trends and search for companies from the Bottom-Up.

Proprietary Philosophy

We construct our portfolios based on our own proprietary investment strategy.

Disciplined Investing

Sticking to our disciplined investment strategy ensures we maintain a consistent, balanced approach.

The Morningstar Rating™ for funds, or "star rating", is calculated for managed products (including mutual funds, variable annuity and variable life subaccounts, exchange-traded funds, closed-end funds, and separate accounts) with at least a three-year history. Exchange-traded funds and open-ended mutual funds are considered a single population for comparative purposes. It is calculated based on a Morningstar Risk-Adjusted Return measure that accounts for variation in a managed product's monthly excess performance, placing more emphasis on downward variations and rewarding consistent performance. The top 10% of products in each product category receive 5 stars, the next 22.5% receive 4 stars, the next 35% receive 3 stars, the next 22.5% receive 2 stars, and the bottom 10% receive 1 star. The Overall Morningstar Rating™ for a managed product is derived from a weighted average of the performance figures associated with its three-, five-, and 10-year (if applicable) Morningstar Rating™ metrics. The weights are: 100% three-year rating for 36-59 months of total returns, 60% five-year rating/40% three-year rating for 60-119 months of total returns, and 50% 10-year rating/30% five-year rating/20% three-year rating for 120 or more months of total returns. While the 10-year overall star rating formula seems to give the most weight to the 10-year period, the most recent three-year period actually has the greatest impact because it is included in all three rating periods.

The Buffalo Early Stage Growth Fund (BUFOX) received 2 stars among 547 for the three-year, 2 stars among 518 for the five-year, and 2 stars among 399 Small Growth funds for the ten-year period ending 8/31/24.

Flexible Allocation Fund

Flexible Allocation Fund

Quick Facts
Investor Institutional
Ticker: BUFBX BUIBX
Daily Pricing:  
As of 9/26/2024  
NAV: $21.30 $21.29
$ Change: $-0.10 $-0.10
% Change:
-0.47% -0.47%
YTD:
13.21% 13.35%
Inception Date: 8/12/1994 7/1/2019
Expense Ratio: 1.01% 0.86%
Total Net Assets: $486.55 Million  (6/30/24)
Morningstar Category: Large Value
Benchmark Index: Russell 3000
Dividend Distribution: Monthly
Related Material:
   Fund Fact Sheet Q2 2024
   PM Commentary Q2 2024
Fund Objective & Investment Process

The investment objective of the Buffalo Flexible Allocation Fund is primarily the generation of high current income and, as a secondary objective, the long-term growth of capital. To pursue its investment objectives, the Flexible Allocation Fund invests in both debt and equity securities.

The allocation of assets invested in each type of security is designed to balance income and long-term capital appreciation with reduced volatility of returns. The Flexible Income Fund expects to change its allocation mix over time based on the Fund managers’ view of economic conditions and underlying security values.

The Fund maintains a flexible investment policy which allows it to invest in debt securities with varying maturities. However, it is anticipated that the dollar-weighted average maturity of debt securities that the Fund purchases will not exceed 15 years.

|
Our investment strategy seeks to generate yield for any investor needing monthly income with capital appreciation, and we use many methods to address potential downside risks.

John Kornitzer, Portfolio Manager

Morningstar Rating


Overall Morningstar Rating™ of BUFBX based on risk-adjusted returns among 1,089 Large Value funds as of 8/31/24.

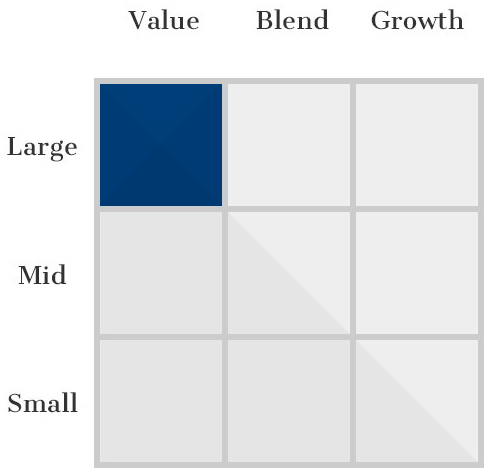
Investment Style

Performance (%)

As of 8/31/243 MOYTD1 YR3 YR5 YR10 YR15 YR20 YRSince Inception
BUFFALO FLEXIBLE ALLOCATION FUND - Investor4.7414.4217.4611.8511.957.829.488.137.82
BUFFALO FLEXIBLE ALLOCATION FUND - Institutional4.7814.5417.6512.0212.127.979.648.297.98
  Russell 3000 Index7.3018.1926.147.8715.1912.3613.9610.5810.64
  Lipper Mixed-Asset Target Allocation Moderate Funds Index5.2410.4416.303.117.586.227.586.266.98
As of 6/30/243 MOYTD1 YR3 YR5 YR10 YR15 YR20 YRSince Inception
BUFFALO FLEXIBLE ALLOCATION FUND - Investor0.4610.5516.7410.9210.687.609.847.937.74
BUFFALO FLEXIBLE ALLOCATION FUND - Institutional0.4510.6416.9211.0910.837.7510.008.097.90
  Russell 3000 Index3.2213.5623.138.0514.1412.1514.4910.1710.56
  Lipper Mixed-Asset Target Allocation Moderate Funds Index0.986.1112.242.566.755.897.886.046.87

20132014201520162017201820192020202120222023
BUFFALO FLEXIBLE ALLOCATION FUND - Investor16.683.59-1.979.9013.21-7.0018.76-2.2430.004.017.43
BUFFALO FLEXIBLE ALLOCATION FUND - Institutional16.853.75-1.8310.0713.38-6.8618.87-2.1030.214.227.53
  Russell 3000 Index33.5512.560.4812.7421.13-5.2431.0220.8925.66-19.2125.96
For performance prior to 7/1/19 (Inception Date of Institutional Class), performance of the Investor Class shares is used and includes expenses not applicable and lower than those of Investor Class shares.Performance data quoted represents past performance; past performance does not guarantee future results. The investment return and principal value of an investment will fluctuate so that an investor’s shares, when redeemed, may be worth more or less than their original cost. Current performance of the fund may be lower of higher than the performance quoted and can be obtained here. Performance is annualized for periods greater than 1 year. Each Morningstar category average represents a universe of funds with similar objectives.
Hypothetical Growth of $10,000
This chart illustrates the performance of a hypothetical $10,000 investment made in the Fund on the Fund’s inception date. Assumes reinvestment of dividends and capital gains. This chart does not imply future performance.
Distributions
2024 Projected Distribution Dates:

Record 10/17/2024 Payable 10/18/2024

Record 11/18/2024 Payable 11/19/2024

Record 12/4/2024 Payable 12/5/2024 Cap Gains (if any)

Record 12/17/2024 Payable 12/18/2024
Record
Date
Payable
Date
Distribution
NAV
Net Investment
Income
Short-Term Capital
Gains
Long-Term Capital
Gains
Distribution
Total
9/17/20249/18/2024$21.41(Inv)

$21.40 (Inst)
0.03360563

0.09380152
-

-
-

-
0.03360563

0.09380152
8/19/20248/20/2024$21.18(Inv)

$21.17 (Inst)
0.04875717

0.05161794
-

-
-

-
0.04875717

0.05161794
7/17/20247/18/2024$21.31(Inv)

$21.30 (Inst)
0.00001602

0.00260696
-

-
-

-
0.00001602

0.00260696
6/17/20246/18/2024$20.75(Inv)

$20.74 (Inst)
0.02888410

0.03152106
-

-
-

-
0.02888410

0.03152106
5/17/20245/20/2024$20.87(Inv)

$20.87 (Inst)
0.04860370

0.05114302
-

-
-

-
0.04860370

0.05114302
4/17/20244/18/2024$20.15(Inv)

$20.14 (Inst)
0.00702538

0.00958157
-

-
-

-
0.00702538

0.00958157
3/18/20243/19/2024$20.52(Inv)

$20.51 (Inst)
0.00271906

0.00495243
-

-
-

-
0.00271906

0.00495243
2/20/20242/21/2024$19.85(Inv)

$19.85 (Inst)
0.01198410

0.01472364
-

-
-

-
0.01198410

0.01472364
1/17/20241/18/2024$19.02 (Inv)

$19.02 (Inst)
0.02220238

0.02456864
-

-
-

-
0.02220238

0.02456864
For historical distributions, click here.

Portfolio

Portfolio Characteristics
(As of 6/30/24) 
 
# of Holdings45
Median Market Cap$85.49 B
Weighted Average Market Cap$537.26 B
3-Yr Annualized Turnover Ratio3.41%
30-day SEC Yield1.66%
Top 10 Holdings
HoldingTicker / MaturitySector% of Net
Assets
Microsoft CorporationMSFTInformation Technology9.89
Eli Lilly and CompanyLLYHealth Care5.57
Costco Wholesale CorporationCOSTConsumer Staples4.49
ConocoPhillipsCOPEnergy4.29
Chevron CorporationCVXEnergy4.03
Exxon Mobil CorporationXOMEnergy3.92
Hess CorporationHESEnergy3.90
Arthur J. Gallagher & Co.AJGFinancials3.58
Allstate CorporationALLFinancials3.36
QUALCOMM IncorporatedQCOMInformation Technology3.05
TOP 10 HOLDINGS TOTAL46.09%
As of 3/31/24. Top 10 Holdings for the quarter are not disclosed until 60 days after quarter end. Fund holdings are subject to change and are not recommendations to buy or sell any securities.
Sector Weighting

As of 6/30/24. Security weightings are subject to change and are not recommendations to buy or sell any securities. Sector Allocation may not equal 100% due to rounding.

Asset Allocation

As of 6/30/24. Allocation percentages may not equal 100% due to rounding.

Management

John Kornitzer
Portfolio Manager

55 Years of Experience

 View full bio

Paul Dlugosch, CFA
Portfolio Manager

26 Years of Experience

 View full bio

Commentary

The opinions expressed are those of the Portfolio Manager(s) and are subject to change, are not guaranteed and should not be considered recommendations to buy or sell any security. Earnings growth is not representative of the fund’s future performance.

Literature

Buffalo Flexible Allocation Fund
Documents
Last
Updated
  Fact Sheet6/30/24
  Quarterly Commentary6/30/24
  Full Fund Holdings3/31/24
  Prospectus7/29/24
  Statement of Additional Information7/29/24
  Annual Report3/31/24
  Semi-Annual Report9/30/23
  Tax Guide - 20231/8/24
General Account
Forms
Investor
Class
Institutional
Class
Both
  New Account Application
  New Account Application - Entity
  Change or Add Account Details
  Cost Basis Method Election
  Power of Attorney
Individual Retirement Account (IRA) Forms
  IRA Account Application
  IRA Beneficiary Addition / Change
  IRA Required Minimum Distribution (RMD)
  IRA / Qualified Plan Distribution Request
  IRA Transfer
Coverdell Education Savings Accounts (ESA) Forms
  Coverdell ESA Application
  Coverdell ESA Distribution Request
  Coverdell ESA Transfer
Retirement Information
  Retirement Savings Options for Individuals

Fundamental Approach

We get to know the companies we invest in and learn how they run their business.

Top-Down & Bottom-Up

We identify Top-Down broad, secular growth trends and search for companies from the Bottom-Up.

Proprietary Philosophy

We construct our portfolios based on our own proprietary investment strategy.

Disciplined Investing

Sticking to our disciplined investment strategy ensures we maintain a consistent, balanced approach.

The Morningstar Rating™ for funds, or "star rating", is calculated for managed products (including mutual funds, variable annuity and variable life subaccounts, exchange-traded funds, closed-end funds, and separate accounts) with at least a three-year history. Exchange-traded funds and open-ended mutual funds are considered a single population for comparative purposes. It is calculated based on a Morningstar Risk-Adjusted Return measure that accounts for variation in a managed product's monthly excess performance, placing more emphasis on downward variations and rewarding consistent performance. The top 10% of products in each product category receive 5 stars, the next 22.5% receive 4 stars, the next 35% receive 3 stars, the next 22.5% receive 2 stars, and the bottom 10% receive 1 star. The Overall Morningstar Rating™ for a managed product is derived from a weighted average of the performance figures associated with its three-, five-, and 10-year (if applicable) Morningstar Rating™ metrics. The weights are: 100% three-year rating for 36-59 months of total returns, 60% five-year rating/40% three-year rating for 60-119 months of total returns, and 50% 10-year rating/30% five-year rating/20% three-year rating for 120 or more months of total returns. While the 10-year overall star rating formula seems to give the most weight to the 10-year period, the most recent three-year period actually has the greatest impact because it is included in all three rating periods.

The Buffalo Flexible Allocation Fund (BUFBX) received 5 stars among 1089 for the 3-year, 4 stars among 1036 for the 5-year, and 3 stars among 810 Large Value funds for the 10-year period ending 8/31/24.

Bond ratings are grades given to bonds that indicates their credit quality as determined by a private independent rating service such as [Standard & Poor’s or Moody’s, etc.]. The firm evaluates a bond issuer’s financial strength, or its ability to pay a bond’s principal and interest in a timely fashion. Ratings are expressed as letters ranging from ‘AAA’, which is the highest grade, to ‘D’, which is the lowest grade. Not Rated category includes holdings that are not rated by any rating agencies.

Growth Fund

Growth Fund

Quick Facts
Investor Institutional
Ticker: BUFGX BIIGX
Daily Pricing:  
As of 9/26/2024  
NAV: $35.90 $36.16
$ Change: $0.17 $0.18
% Change:
0.48% 0.50%
YTD:
18.99% 19.10%
Inception Date: 5/19/1995 7/1/2019
Expense Ratio: 0.92% 0.77%
Total Net Assets: $178.38 Million  (6/30/24)
Morningstar Category: Large Cap Growth
Benchmark Index: Russell 3000 Growth
Related Material:
   Fund Fact Sheet Q2 2024
   PM Commentary Q2 2024
Fund Objective & Investment Philosophy

The investment objective of the Buffalo Growth Fund is long-term growth of capital. The Fund invests in common stocks and other equity securities, including preferred stock, convertible securities, warrants and rights, with a goal of maintaining at least 75% of the Fund’s portfolio in companies with market capitalizations greater than the median of the Russell 3000 Growth Index at the time of purchase or $5 billion, whichever is lower. The median market capitalization of the Russell 3000 Growth Index changes due to market conditions and also changes with the composition of the index.

With respect to the remaining 25% of the equity weighting of the Fund’s portfolio, the Fund may invest in companies of any size, including, but not limited to, those with market capitalizations less than the lower of the median of the Russell 3000 Growth Index or $5 billion, whichever is lower.

The Fund managers seek to identify companies that are expected to experience growth based on the identification of long-term, measurable secular trends, and which, as a result, the managers believe may have potential revenue growth in excess of the gross domestic product growth rate. Companies are screened using in-depth, in-house research to identify those which the managers believe have favorable attributes, including attractive valuation, strong management, conservative debt, free cash flow, scalable business models, and competitive advantages.

|

The Growth Fund invest in secular trend leaders: attractively-priced, financially-strong, well-managed companies across all market cap segments, which we believe are favorably positioned to harvest the lion’s share of big secular growth trends.

Dave Carlsen, CFA, Co-Portfolio Manager

Morningstar Ratings


Overall Morningstar Rating™ of BUFGX based on risk-adjusted returns among 1,083 Large Growth funds as of 8/31/24

Performance (%)

As of 8/31/243 MOYTD1 YR3 YR5 YR10 YR15 YR20 YRSince Inception
BUFFALO GROWTH FUND - Investor7.6016.8023.845.4013.7112.4413.6810.8610.89
BUFFALO GROWTH FUND - Institutional7.6116.9023.935.5413.8712.6013.8511.0211.06
  Russell 3000 Growth Index7.1020.6630.108.2518.4315.5216.2912.3610.81
  Lipper Large Cap Growth Fund Index6.3621.2930.935.8716.7714.2714.9111.279.78
As of 6/30/243 MOYTD1 YR3 YR5 YR10 YR15 YR20 YRSince Inception
BUFFALO GROWTH FUND - Investor5.0715.4525.537.1913.6512.4014.3910.4010.91
BUFFALO GROWTH FUND - Institutional5.0615.5125.667.3213.8012.5614.5510.5611.08
  Russell 3000 Growth Index3.2213.5623.138.0514.1412.1514.4910.1710.36
  Lipper Large Cap Growth Fund Index6.7420.7733.627.9016.7614.5715.5910.879.83

20132014201520162017201820192020202120222023
BUFFALO GROWTH FUND - Investor35.408.882.644.8622.810.5131.9128.2921.69-31.1342.64
BUFFALO GROWTH FUND - Institutional35.609.052.805.0222.990.6632.1128.4921.85-31.0342.79
  Russell 3000 Growth Index34.2312.445.097.3929.59-2.1235.8538.2625.85-28.9741.21
For performance prior to 7/1/19 (Inception Date of Institutional Class), performance of the Investor Class shares is used and includes expenses not applicable and lower than those of Investor Class shares.Performance data quoted represents past performance; past performance does not guarantee future results. The investment return and principal value of an investment will fluctuate so that an investor’s shares, when redeemed, may be worth more or less than their original cost. Current performance of the fund may be lower of higher than the performance quoted and can be obtained here. Performance is annualized for periods greater than 1 year. Each Morningstar category average represents a universe of funds with similar objectives.
3 Year Risk Metrics
BUFGX vs Russell 3000 Growth Index (As of 6/30/24)
Upside Capture95.63
Downside Capture104.60
Alpha-2.75
Beta0.99
Sharpe Ratio0.99
Hypothetical Growth of $10,000
This chart illustrates the performance of a hypothetical $10,000 investment made in the Fund on the Fund’s inception date. This chart does not imply future performance.

Portfolio

Portfolio Characteristics
(As of 6/30/24) 
 
# of Holdings41
Median Market Cap$139.94 B
Weighted Average Market Cap$1485.52 B
3-Yr Annualized Turnover Ratio10.65%
% of Holdings with Free Cash Flow92.68%
Active Share42.58%
Top 10 Holdings
Name of HoldingTickerSector% of Net
Assets
Microsoft CorporationMSFTInformation Technology12.44
Alphabet Inc.GOOGLCommunication Services9.67
Apple Inc.AAPLInformation Technology7.94
Amazon.com Inc.AMZNConsumer Discretionary7.36
NVIDIA CorporationNVDAInformation Technology6.33
Meta Platforms Inc.METACommunication Services4.30
Mastercard IncorporatedMAFinancials3.32
Visa Inc.VFinancials2.71
Uber Technologies Inc.UBERConsumer Discretionary2.47
Salesforce Inc.CRMInformation Technology2.33
TOP 10 HOLDINGS TOTAL58.88%
As of 3/31/24. Top 10 Holdings for the quarter are not disclosed until 60 days after quarter end. Fund holdings are subject to change and are not recommendations to buy or sell any securities.
Sector Weighting

As of 6/30/24. Security weightings are subject to change and are not recommendations to buy or sell any securities. Sector Allocation may not equal 100% due to rounding.

Market Capitalization

As of 6/30/24. Market Cap percentages may not equal 100% due to rounding.

Management

Dave Carlsen, CFA
Portfolio Manager

31 Years of Experience

 View full bio

Josh West, CFA
Portfolio Manager

18 Years of Experience

 View full bio

Commentary

The opinions expressed are those of the Portfolio Manager(s) and are subject to change, are not guaranteed and should not be considered recommendations to buy or sell any security. Investing in both actively and passively managed mutual funds involves risk and principal loss is possible. Earnings growth is not representative of the fund’s future performance.

Literature

General Account
Forms
Investor
Class
Institutional
Class
Both
  New Account Application
  New Account Application - Entity
  Change or Add Account Details
  Cost Basis Method Election
  Power of Attorney
Individual Retirement Account (IRA) Forms
  IRA Account Application
  IRA Beneficiary Addition / Change
  IRA Required Minimum Distribution (RMD)
  IRA / Qualified Plan Distribution Request
  IRA Transfer
Coverdell Education Savings Accounts (ESA) Forms
  Coverdell ESA Application
  Coverdell ESA Distribution Request
  Coverdell ESA Transfer
Retirement Information
  Retirement Savings Options for Individuals

Fundamental Approach

We get to know the companies we invest in and learn how they run their business.

Top-Down & Bottom-Up

We identify Top-Down broad, secular growth trends and search for companies from the Bottom-Up.

Proprietary Philosophy

We construct our portfolios based on our own proprietary investment strategy.

Disciplined Investing

Sticking to our disciplined investment strategy ensures we maintain a consistent, balanced approach.

Morningstar Rating™

The Morningstar Rating™ for funds, or "star rating", is calculated for managed products (including mutual funds, variable annuity and variable life subaccounts, exchange-traded funds, closed-end funds, and separate accounts) with at least a three-year history. Exchange-traded funds and open-ended mutual funds are considered a single population for comparative purposes. It is calculated based on a Morningstar Risk-Adjusted Return measure that accounts for variation in a managed product's monthly excess performance, placing more emphasis on downward variations and rewarding consistent performance. The Morningstar Rating does not include any adjustment for sales loads. The top 10% of products in each product category receive 5 stars, the next 22.5% receive 4 stars, the next 35% receive 3 stars, the next 22.5% receive 2 stars, and the bottom 10% receive 1 star. The Overall Morningstar Rating™ for a managed product is derived from a weighted average of the performance figures associated with its three-, five-, and 10-year (if applicable) Morningstar Rating™ metrics. The weights are: 100% three-year rating for 36-59 months of total returns, 60% five-year rating/40% three-year rating for 60-119 months of total returns, and 50% 10-year rating/30% five-year rating/20% three-year rating for 120 or more months of total returns. While the 10-year overall star rating formula seems to give the most weight to the 10-year period, the most recent three-year period actually has the greatest impact because it is included in all three rating periods.

©2024 Morningstar, Inc. All Rights Reserved. The information contained herein: (1) is proprietary to Morningstar; (2) may not be copied or distributed; and (3) is not warranted to be accurate, complete or timely. Neither Morningstar nor its content providers are responsible for any damages or losses arising from any use of this information. Past performance is no guarantee of future results.

The Buffalo Growth Fund (BUFGX) received 3 stars among 1,083 for the 3-year, 2 stars among 1,012 for the 5-year, and 3 stars among 796 Large Growth funds for the 10-year period ending 8/31/24. Other share classes may have different performance characteristics.