No Results Found
The page you requested could not be found. Try refining your search, or use the navigation above to locate the post.
Kiplinger recognized the Buffalo Small Cap and the Buffalo Emerging Opportunities funds as “Top-Performing Mutual Funds” in their recent fund analysis for the period ending November 30, 2019.
The Buffalo Small Cap Fund (BUFSX) ranked #4 in the Small-Company Stock Funds category for 20-year annualized returns, and the Buffalo Emerging Opportunities Fund (BUFOX) ranked #9 in the same category for 10-year annualized returns.
Management Teams:
The page you requested could not be found. Try refining your search, or use the navigation above to locate the post.
The page you requested could not be found. Try refining your search, or use the navigation above to locate the post.
Stay up-to-date with the most recent media coverage and press releases about the Buffalo Funds.
Kiplinger recognized the Buffalo Small Cap and the Buffalo International Funds as “Top-Performing Mutual Funds” in their recent fund analysis for the period ending October 31, 2019.
The Buffalo Small Cap Fund (BUFSX) ranked #3 in the Small-Company Stock Funds category for 20-year annualized returns, and the Buffalo International Fund (NASDAQ: BUFIX) ranked #10 in the International Diversified Large-Company Funds category for 5-year annualized returns.
Management Teams:
The page you requested could not be found. Try refining your search, or use the navigation above to locate the post.
The page you requested could not be found. Try refining your search, or use the navigation above to locate the post.
Stay up-to-date with the most recent media coverage and press releases about the Buffalo Funds.


Date Published:
October 2019
Pages:
3
OVERVIEW:
For all of the excitement that transpired in the 3rd quarter, it was remarkable that the U.S. equity market eked out a modest increase of 1.70% for the quarter, as measured by the S&P 500 Index. While the absolute returns continue to help extend the longest bull market on record, the rapidly-changing environment continues to increase the volatility in the market to whatever the flavor of the day is.
In this latest Industry Perspectives, we discuss:
We get to know the companies we invest in and learn how they run their business.
We identify Top-Down broad, secular growth trends and search for companies from the Bottom-Up.
We construct our portfolios based on our own proprietary investment strategy.
Sticking to our disciplined investment strategy ensures we maintain a consistent, balanced approach.
Stay up-to-date with the most recent media coverage and press releases about the Buffalo Funds.
Buffalo International Fund co-portfolio manager Nicole Kornitzer, CFA, was recently interviewed by Barron’s about the parallels she finds in gourmet cooking and international investing. In the article, she describes the team’s approach to picking premier growth stocks based on in-depth analysis of company fundamentals and highlights the team’s long-term investment philosophy that focuses less on short-term market movements.
“We need to be able to answer the question of why is the company going to continue growing.“
~ Nicole Kornitzer, CFA
Nicole also discusses several foreign large-cap stocks in the BUFIX/BUIIX portfolio which illustrate the Fund’s investment process in action:
Opinions expressed are those of the author or Funds and are subject to change, are not intended to be a forecast of future events, a guarantee of future results, nor investment advice. References to other mutual funds should not to be considered an offer to buy or sell these securities. A complete list of the Fund’s holdings can be found here. Fund holdings are subject to change and should not be considered a recommendation to buy or sell any security.
Annualized Performance (%)
| As of 3/31/25 | 3 MO | YTD | 1 YR | 3 YR | 5 YR | 10 YR | Since Inception |
|---|---|---|---|---|---|---|---|
| BUFFALO INTERNATIONAL FUND - Investor | 5.10 | 5.10 | -2.19 | 2.67 | 10.87 | 7.16 | 5.32 |
| BUFFALO INTERNATIONAL FUND - Institutional | 5.20 | 5.20 | -2.01 | 2.83 | 11.05 | 7.32 | 5.48 |
| FTSE All World Ex-US Index | 5.05 | 5.05 | 6.65 | 4.98 | 11.67 | 5.62 | 3.40 |
| Lipper International Fund Index | 6.66 | 6.66 | 6.22 | 6.06 | 12.38 | 5.72 | 3.50 |
The expense ratio for BUIIX is 0.91% and 1.06% for BUFTX. Performance data quoted represents past performance; past performance does not guarantee future results. The investment return and principal value of an investment will fluctuate so that an investor’s shares, when redeemed, may be worth more or less than their original cost. Current performance of the fund may be lower of higher than the performance quoted and can be found here; quarter-end performance can be found here. Performance is annualized for periods greater than 1 year.

Nicole Kornitzer, Buffalo International Fund co-portfolio manager, discusses her team’s approach to finding premier growth companies that are poised to take advantage of global trends.
Joel Crampton
Director of Marketing
(913) 647-9881
List of the “Top 20 Female Portfolio Managers in the U.S.” according to Citywire includes Buffalo Fund manager Nicole Kornitzer, one of only 7 women to be included in consecutive years.
Kiplinger recognized the Buffalo Small Cap and the Buffalo International funds as “Top-Performing Mutual Funds” in their recent fund analysis.
Nicole Kornitzer, Buffalo International Fund co-portfolio manager, discusses her team’s approach to finding premier growth companies that are poised to take advantage of global trends.
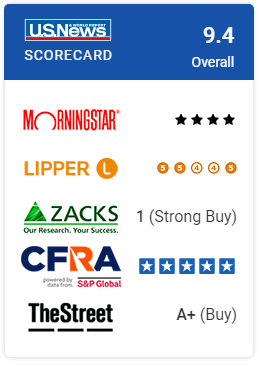
U.S. News & World Report recognized the Buffalo International Fund in their recent “Best Mutual Funds” fund analysis.
U.S. News & World Report recognized the Buffalo International Fund in their recent “Best Mutual Funds” fund analysis for the period ending July 31, 2019.
The Buffalo International Fund (NASDAQ: BUFIX) ranked #2 out of 470 Foreign Large Growth funds based on the overall equal weightings of ratings from 5 data sources – Morningstar, Lipper, Zacks, CFRA S&P, TheStreet.
Management Team:
Performance quoted by US News may not be current. For current quarter-end standardized performance and disclosure information, please click here.
Current U.S. News ranking and additional information can be found here https://money.usnews.com/funds/mutual-funds/foreign-large-growth/buffalo-international-fund/bufix . The Overall Morningstar Rating™ for a managed product is derived from a weighted average of the performance figures associated with its 3-, 5-, and 10-year (if applicable) Morningstar Rating™ metrics. While the U.S. News Mutual Fund Score combines all 5 equally weighted category scores to achieve its weighting, Lipper intends its measures to be used as individual assessments of a fund’s ability to meet specific goals, rather than as a cumulative measure of fund quality. Lipper rankings are comprised of five unique measures (Total Return, Consistent Return, Preservation, Expense, and Tax Efficiency), each with a 1-to-5 score, ranking each fund against its peers. The highest 20% of funds in each peer group are named Lipper Leaders, the next 20% receive a rating of 4, the middle 20% are rated 3, the next 20% are rated 2, and the lowest 20% are rated 1. The overall calculation is based on an equal-weighted average of percentile ranks for each measure over 3-, 5-, and 10-year periods (if applicable). Lipper Ratings for Total Return reflect funds’ historical total return performance relative to peers. Lipper Ratings for Consistent Return reflect funds’ historical risk-adjusted returns, relative to peers. Lipper Ratings for Preservation reflect funds’ historical loss avoidance relative to other funds within the same asset class. Lipper Ratings for Tax Efficiency reflect funds’ historical success in postponing taxable distributions relative to peers. Lipper Ratings for Expense reflect funds’ expense minimization relative to peers with similar load structures. The Zacks Mutual Fund Rank ranks funds on a scale from 1 to 5, with 1 being a Strong Buy and 5 being a Strong Sell. Each quarter, Zacks updates their Mutual Fund Rank by evaluating the average Zacks Rank for the stocks owned by the fund and blending this with other criteria their studies show is beneficial in finding funds that will outperform in the future. In general, the higher the average Zacks Rank for the stocks in the fund, then the higher the Zacks Mutual Fund Rank. TheStreet.com Ratings Investment Ratings for Funds condense the available fund performance and risk data into a single composite opinion of each fund’s risk-adjusted performance. “A (Buy) Excellent” rating means the fund has an excellent track record of maximizing performance while minimizing risk, thus delivering the best possible combination of total return on investment and reduced volatility. “B (Buy) Good” rating means the fund has a good track record of balancing performance with risk. “C (Hold) Fair” rating ratings means the fund has a track record which is about average. “D (Sell) Weak” rating means the fund has underperformed the universe of other funds given the level of risk in its underlying investments, resulting in a weak risk-adjusted performance. “E (Sell) Very Weak” rating means the fund has significantly underperformed most other funds given the level of risk in its underlying investments, resulting in a very weak risk-adjusted performance. The plus sign (+) is an indication that the fund is in the top third of its letter grade. The minus sign (-) is an indication that the fund is in the bottom third of its letter grade. “U Unrated” rating means the fund does not have sufficient history to make a reliable assessment of its risk-adjusted performance. The CFRA Rankings range from five-star (highest) to one-star (lowest) and follow a normalized distribution curve, based upon the fund’s rank in its Category. Top 10% receive 5 stars, next 20% receive 4 stars, middle 40% receive 3 stars, next 20% receive 2 stars, and the bottom 10% receive 1 star. Rankings are refreshed on a weekly basis to incorporate the latest inputs from the holdings-based analysis and the latest relative performance review. The Morningstar Rating™ for funds, or “star rating”, is calculated for managed products (including mutual funds, variable annuity and variable life subaccounts, exchange-traded funds, closed-end funds, and separate accounts) with at least a three-year history. Exchange-traded funds and open-ended mutual funds are considered a single population for comparative purposes. It is calculated based on a Morningstar Risk-Adjusted Return measure that accounts for variation in a managed product’s monthly excess performance, placing more emphasis on downward variations and rewarding consistent performance. The top 10% of products in each product category receive 5 stars, the next 22.5% receive 4 stars, the next 35% receive 3 stars, the next 22.5% receive 2 stars, and the bottom 10% receive 1 star. The Overall Morningstar Rating™ for a managed product is derived from a weighted average of the performance figures associated with its 3-, 5-, and 10-year (if applicable) Morningstar Rating™ metrics. The weights are: 100% 3-year rating for 36-59 months of total returns, 60% 5-year rating/40% 3-year rating for 60-119 months of total returns, and 50% 10-year rating/30% 5-year rating/20% 3-year rating for 120 or more months of total returns. While the 10-year overall star rating formula seems to give the most weight to the 10-year period, the most recent 3-year period actually has the greatest impact because it is included in all 3 rating periods. ©2019 Morningstar, Inc. All Rights Reserved. The information contained herein: (1) is proprietary to Morningstar; (2) may not be copied or distributed; and (3) is not warranted to be accurate, complete or timely. Neither Morningstar nor its content providers are responsible for any damages or losses arising from any use of this information. Past performance is no guarantee of future results.
The page you requested could not be found. Try refining your search, or use the navigation above to locate the post.
Stay up-to-date with the most recent media coverage and press releases about the Buffalo Funds.
Home > Insights & News > White Papers & Research > Industry Perspectives 2Q 2019

Date Published:
July 2019
Pages:
3
OVERVIEW:
The S&P 500 Index posted its best 1st half of a calendar year since 1997, rising 18.54% from January 1 to June 30. As we have discussed previously, two main underlying forces – central banks and trade policies – continued to drive financial markets during the period and will likely continue to do so going forward.
In this latest Industry Perspectives, we discuss:
We get to know the companies we invest in and learn how they run their business.
We identify Top-Down broad, secular growth trends and search for companies from the Bottom-Up.
We construct our portfolios based on our own proprietary investment strategy.
Sticking to our disciplined investment strategy ensures we maintain a consistent, balanced approach.
Stay up-to-date with the most recent media coverage and press releases about the Buffalo Funds.