
Total Assets $490.02 Million (3/31/22)
Expense Ratio 1.01% / 0.86%
Benchmark Morningstar Moderately Aggressive Target Risk

Small Cap Fund
Small Cap Fund
Quick Facts
| Investor | Institutional | |
| Ticker: | BUFSX | BUISX |
| Daily Pricing: | ||
| As of 4/23/2024 | ||
| NAV: | $13.89 | $13.99 |
| $ Change: | $0.22 | $0.22 |
| % Change: |
1.61% | 1.60% |
| YTD: |
-1.63% | -1.62% |
| Inception Date: | 4/14/1998 | 7/1/2019 |
| Expense Ratio: | 0.99% | 0.87% |
| Total Net Assets: | $705.85 Million (3/31/24) | |
| Morningstar Category: | Small Cap Growth | |
| Benchmark Index: | Russell 2000 Growth | |
|
Related Material: Fund Fact Sheet Q1 2024 PM Commentary Q4 2023 Portfolio Manager Q&A |
||
|
An actively-managed portfolio of smaller-capitalization, rapidly-growing companies that can benefit from positive, long-term trends remains an excellent way to exploit an inefficient market.
Bob Male, Portfolio Manager
Listen to the Portfolio Managers discuss their Investment Philosophy
Morningstar Rating


Overall Morningstar Rating™ of BUFSX based on risk-adjusted returns among 552 Small Growth funds as of 3/31/24.
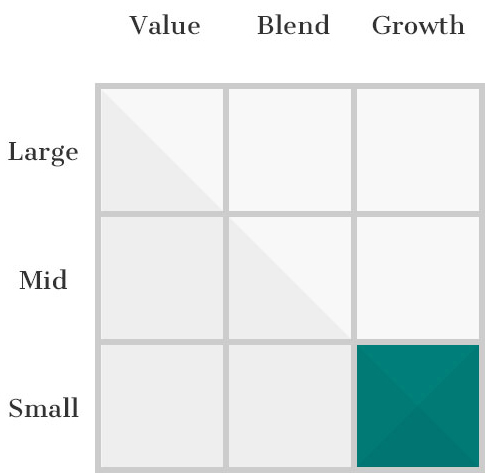
Investment Style
Fund Objective & Investment Philosophy
The investment objective of the Buffalo Small Cap Fund is long-term growth of capital. The Small Cap Fund normally invests at least 80% of its net assets in equity securities, consisting of common stocks, preferred stocks, convertible preferred stocks, warrants and rights of small capitalization (“small-cap”) companies. The Small Cap Fund defines small-cap companies as those that, at the time of purchase, have market capitalizations within the range of the Russell 2000 Growth Index.
The Fund managers seek to identify companies for the Fund’s portfolio that are expected to experience growth based on the identification of long-term, measurable secular trends, and which, as a result, the managers believe may have potential revenue growth in excess of the gross domestic product growth rate. Companies are screened using in-depth, in-house research to identify those which the managers believe have attractive valuation, strong management, conservative debt, free cash flow, scalable business models, and competitive advantages.
Recent Recognition
- Kiplinger Top-Performing Mutual Fund (3 Years) – January 24, 2022
- Kiplinger Top-Performing Mutual Fund (3 Years, 20 Years) – November 18, 2021
- Kiplinger Top-Performing Mutual Fund (20 Years) – October 20, 2021
- Kiplinger Top-Performing Mutual Fund (20 Years) – September 21, 2021
- Kiplinger Top-Performing Mutual Fund (20 Years) – August 18, 2021
- Kiplinger Top-Performing Mutual Fund (3 Years, 5 Years, 10 Years, 20 Years) – July 28, 2021
- Kiplinger Top-Performing Mutual Fund (3 Years, 5 Years, 20 Years) – June 17, 2021
- Kiplinger Top-Performing Mutual Fund (3 Years, 20 Years) – May 13, 2021
- Kiplinger Top-Performing Mutual Fund (3 Years, 20 Years) – April 22, 2021
- Kiplinger Top-Performing Mutual Fund (1 Year, 20 Years) – March 23, 2021
- Investor’s Business Daily 2021 Best Mutual Funds Award Winner – March 22, 2021
- Kiplinger Top-Performing Mutual Fund (1 Year, 20 Years) – February 23, 2021
- Kiplinger Top-Performing Mutual Fund (1 Year, 20 Years) – January 19, 2021
Featured Articles & Reports
BARRON'S
“Profile of Small Cap PM Bob Male”
September 29, 2021
KANSAS CITY BUSINESS JOURNAL
BARRON'S
Barron’s Live “What to Watch in the Markets”
April 19, 2021
FINANCIAL ADVISOR MAGAZINE
“This Small-Cap Fund Is Performing Big”
March 9, 2021
Performance (%)
| As of 3/31/24 | 3 MO | YTD | 1 YR | 3 YR | 5 YR | 10 YR | 15 YR | 20 YR | Since Inception |
|---|---|---|---|---|---|---|---|---|---|
| BUFFALO SMALL CAP FUND - Investor | 4.32 | 4.32 | 3.88 | -8.76 | 9.22 | 8.34 | 12.35 | 8.59 | 11.12 |
| BUFFALO SMALL CAP FUND - Institutional | 4.36 | 4.36 | 4.07 | -8.63 | 9.37 | 8.49 | 12.51 | 8.75 | 11.29 |
| Russell 2000 Growth Index | 7.58 | 7.58 | 20.35 | -2.68 | 7.38 | 7.89 | 13.39 | 8.38 | 6.36 |
| Lipper Small Cap Growth Fund Index | 7.75 | 7.75 | 19.70 | -0.20 | 9.47 | 9.40 | 13.96 | 8.62 | 7.53 |
| Year | 2013 | 2014 | 2015 | 2016 | 2017 | 2018 | 2019 | 2020 | 2021 | 2022 |
|---|---|---|---|---|---|---|---|---|---|---|
| BUFFALO SMALL CAP FUND - Investor | 44.15 | -6.55 | -4.46 | 6.22 | 27.07 | -5.78 | 40.97 | 66.36 | 4.85 | -30.01 |
| BUFFALO SMALL CAP FUND - Institutional | 44.36 | -6.41 | -4.32 | 6.37 | 27.26 | -5.64 | 41.17 | 66.60 | 4.97 | -29.88 |
| Russell 2000 Growth Index | 43.30 | 5.60 | -1.38 | 11.32 | 22.17 | -9.31 | 28.48 | 34.63 | 2.83 | -26.36 |
| Morningstar U.S. Small Growth Index | 41.86 | 2.46 | -0.18 | 9.61 | 23.77 | -5.67 | 27.60 | 43.52 | -1.00 | -33.31 |
For performance prior to 7/1/19 (Inception Date of Institutional Class), performance of the Investor Class shares is used and includes expenses not applicable and lower than those of Investor Class shares.Performance data quoted represents past performance; past performance does not guarantee future results. The investment return and principal value of an investment will fluctuate so that an investor’s shares, when redeemed, may be worth more or less than their original cost. Current performance of the fund may be lower of higher than the performance quoted and can be obtained here. Performance is annualized for periods greater than 1 year. Each Morningstar category average represents a universe of funds with similar objectives.
3 Year Risk Metrics
| BUFSX vs Russell 2000 Growth Index (As of 3/31/24) | |
|---|---|
| Upside Capture | 86.05 |
| Downside Capture | 106.31 |
| Alpha | -5.97 |
| Beta | 1.02 |
| Sharpe Ratio | -0.49 |
Hypothetical Growth of $10,000
This chart illustrates the performance of a hypothetical $10,000 investment made in the Fund on the Inception Date. Assumes reinvestment of dividends and capital gains. This chart does not imply future performance.
Portfolio
Portfolio Characteristics
| (As of 3/31/24) | |
|---|---|
| # of Holdings | 72 |
| Median Market Cap | $3.24 B |
| Weighted Average Market Cap | $4.50 B |
| 3-Yr Annualized Turnover Ratio | 43.99% |
| % of Holdings with Free Cash Flow | 70.83% |
| Active Share | 91.41% |
Top 10 Holdings
| Name of Holding | Ticker | Sector | % of Net Assets |
|---|---|---|---|
| DoubleVerify Holdings, Inc. | DV | Information Technology | 2.86 |
| Summit Materials, Inc. Class A | SUM | Materials | 2.54 |
| PGT Innovations, Inc. | PGTI | Industrials | 2.50 |
| Hamilton Lane Incorporated Class A | HLNE | Financials | 2.46 |
| Endava Plc Sponsored ADR Class A | DAVA | Information Technology | 2.27 |
| ICF International, Inc. | ICFI | Industrials | 2.24 |
| MGP Ingredients, Inc. | MGPI | Consumer Staples | 2.21 |
| AZEK Co., Inc. Class A | AZEK | Industrials | 2.11 |
| Calix, Inc. | CALX | Information Technology | 2.05 |
| Shift4 Payments, Inc. Class A | FOUR | Financials | 2.04 |
| TOP 10 HOLDINGS TOTAL | 23.26% | ||
Sector Weighting
As of 3/31/24. Security weightings are subject to change and are not recommendations to buy or sell any securities. Sector Allocation may not equal 100% due to rounding.
Market Capitalization
As of 3/31/24. Market Cap percentages may not equal 100% due to rounding.
Management


Commentary
PERFORMANCE COMMENTARY
(As of 12/31/23) —
The Buffalo Small Cap Fund produced a return of 7.79% for the quarter, a result
that trailed the Russell 2000 Growth Index return of 12.75%. Weak stock selection
within the Health Care sector which represented 20.4% of the index weighting was
responsible for most of the relative underperformance. Helping offset a portion
of underperformance was positive stock selection within both the Financials and
Materials sectors.
Top Contributors
The fund’s largest contributors to performance for the quarter was PGT Innovations
and DoubleVerify. PGT Innovations is a leading manufacturer of residential impact
resistant windows and doors. The company entered into an agreement to be acquired
by Masonite International Corp causing the shares to move higher on the proposed
announced acquisition. DoubleVerify provides digital advertisers with measurement
and analytics services to ensure advertisers reach their intended audience in the right
setting. The company reported strong earnings with results ahead of expectations led
by growth in brand suitability solutions (ensuring advertisements appear alongside
non-controversial content) while also beginning to gain more traction in international
markets. We are confident in the long-term fundamentals of the company and the stock
remains one of the fund’s largest investment holdings.
Top Detractors
The fund’s largest detractors from performance in the quarter were Establishment
Labs and Chart Industries. Establishment Labs is a medical device company focused
on bringing safer breast implants to the breast augmentation and reconstruction
marketplaces. A softer consumer spending outlook in many of the company’s
international geographies caused a pause in growth and resulted in disappointing results
for the second half of 2023. We remain optimistic on the long-term growth opportunity
for the company as it is on the cusp of entering both the U.S. and Chinese markets which
should effectively double its current market opportunity. Meanwhile, Chart Industries,
which manufactures highly engineered equipment for the industrial gas, energy, and biomedical industries reported third quarter results that missed expectations due to
supply chain issues and customer delays. However, orders and backlog were strong in
the quarter and guidance for 2024 was positive. Additionally, assets sales announced
in the quarter came in ahead of schedule. We remain positive about the long-term
fundamentals of the company and believe the stock is attractively valued at current levels.
OUTLOOK
(As of 12/31/23) —
While the employment environment remains strong, excess household savings
accumulated during the pandemic are being exhausted. In the fourth quarter, the
Fed signaled a more dovish position and paused its aggressive interest rate hikes
as inflation began to moderate and approached its 2% target. As a result, small cap
stocks experienced a sharp rebound in the fourth quarter with the Russell 2000
Growth Index advancing 12.75% and the Russell Microcap Index surging 16.06% with
lower market cap stocks and non-earners as the biggest drivers of performance.
As the economy slows and the Fed moves from a position of raising interest rates to
lowering rates and halts quantitative tightening, we are becoming increasingly more
positive on the outlook for small cap stocks. Valuation levels of small caps relative
to large caps remain at historically attractive levels. Additionally, the performance
gap between small cap stocks and large cap stocks remains wide relative to
historical levels, and we believe this performance gap will compress. This creates an
environment ripe for investment in small cap companies that demonstrate durable
growth. We continue to seek high quality companies that meet our investment
criteria including strong management teams, consistent free cash flow generation,
scalable business models, and sustainable competitive advantages. We believe that
such companies are well-positioned to weather economic headwinds and deliver
sustainable returns with manageable levels of risk. During the fourth quarter we added
three new investments to the fund, exited seven positions, and ended the year with 72
holdings. Thank you for your continued trust and interest in the fund.
The opinions expressed are those of the Portfolio Manager(s) and are subject to change, are not guaranteed and should not be considered recommendations to buy or sell any security. Earnings growth is not representative of the fund’s future performance.
Literature
| Buffalo Small Cap Fund Documents | Last Updated |
|---|---|
| Fact Sheet | 3/31/24 |
| Quarterly Commentary | 12/31/23 |
| Full Fund Holdings | 6/30/23 |
| Prospectus | 7/28/23 |
| Statement of Additional Information | 7/28/23 |
| Annual Report | 3/31/23 |
| Semi-Annual Report | 9/30/22 |
| Tax Guide - 2023 | 1/8/24 |
Fundamental Approach
We get to know the companies we invest in and learn how they run their business.
Top-Down & Bottom-Up
We identify Top-Down broad, secular growth trends and search for companies from the Bottom-Up.
Proprietary Philosophy
We construct our portfolios based on our own proprietary investment strategy.
Disciplined Investing
Sticking to our disciplined investment strategy ensures we maintain a consistent, balanced approach.
The Morningstar Rating™ for funds, or "star rating", is calculated for managed products (including mutual funds, variable annuity and variable life subaccounts, exchange-traded funds, closed-end funds, and separate accounts) with at least a three-year history. Exchange-traded funds and open-ended mutual funds are considered a single population for comparative purposes. It is calculated based on a Morningstar Risk-Adjusted Return measure that accounts for variation in a managed product's monthly excess performance, placing more emphasis on downward variations and rewarding consistent performance. The top 10% of products in each product category receive 5 stars, the next 22.5% receive 4 stars, the next 35% receive 3 stars, the next 22.5% receive 2 stars, and the bottom 10% receive 1 star. The Overall Morningstar Rating™ for a managed product is derived from a weighted average of the performance figures associated with its three-, five-, and 10-year (if applicable) Morningstar Rating™ metrics. The weights are: 100% three-year rating for 36-59 months of total returns, 60% five-year rating/40% three-year rating for 60-119 months of total returns, and 50% 10-year rating/30% five-year rating/20% three-year rating for 120 or more months of total returns. While the 10-year overall star rating formula seems to give the most weight to the 10-year period, the most recent three-year period actually has the greatest impact because it is included in all three rating periods.
The Buffalo Small Cap Fund (BUFSX) received 2 stars among 552 for the 3-year, 3 stars among 520 for the 5-year, and 2 stars among 400 Small Growth funds for the 10-year period ending 3/31/24, based on risk-adjusted returns.
Diversification does not assure a profit, nor does it protect against a loss in a declining market.
Active investing has higher management fees because of the manager’s increased level of involvement while passive investing has lower management and operating fees. Investing in both actively and passively managed mutual funds involves risk and principal loss is possible. Both actively and passively managed mutual funds generally have daily liquidity. There are no guarantees regarding the performance of actively and passively managed mutual funds. Actively managed mutual funds may have higher portfolio turnover than passively managed funds. Excessive turnover can limit returns and can incur capital gains.