No Results Found
The page you requested could not be found. Try refining your search, or use the navigation above to locate the post.
| Investor | Institutional | |
| Ticker: | BUFIX | BUIIX |
| Daily Pricing: | ||
| As of 5/9/2025 | ||
| NAV: | $22.90 | $22.91 |
| $ Change: | $0.06 | $0.06 |
| % Change: |
0.26% | 0.26% |
| YTD: |
11.22% | 11.27% |
| Inception Date: | 9/28/2007 | 7/1/2019 |
| Expense Ratio: | 1.05% | 0.90% |
| Total Net Assets: | $877.51 Million (3/31/25) | |
| Morningstar Category: | Foreign Large Cap Growth | |
| Benchmark Index: | FTSE All World Ex-US | |
|
Related Material: Fund Fact Sheet Q1 2025 PM Commentary Q1 2025 Portfolio Manager Q&A |
||


Overall Morningstar Rating™ of BUFIX based on risk-adjusted returns among 369 Foreign Large Growth funds as of 3/31/25.
The investment objective of the Buffalo International Fund is long-term growth of capital. The International Fund invests primarily in equity securities of established companies that are economically tied to various countries throughout the world (excluding the U.S.).
For purposes of the International Fund’s investments, “foreign securities” means those securities issued by companies:
In selecting securities for the International Fund, the Fund managers use a bottom-up approach in choosing investments, seeking companies expected to experience growth based on the identification of long-term, measurable industry, technological, global or other trends. Companies are screened using in-depth, in-house research to identify those which the Fund managers believe have favorable attributes, including: attractive valuation, strong management, conservative debt, free cash flow, scalable business models, and competitive advantages.
In making portfolio selections the Fund managers will also consider the economic, political and market conditions of the various countries in which the Fund may invest.
When it comes to investing internationally, we believe our approach to stock selection is distinct. We are focused on finding good companies and aren’t constrained by benchmark alignment to countries or industries.
Our approach is based on finding companies with sound business models, exposure to long-term secular growth trends, and attractive risk/return growth and valuation characteristics, which we can own for the long-term.
Nicole Kornitzer, Portfolio Manager
| As of 3/31/25 | 3 MO | YTD | 1 YR | 3 YR | 5 YR | 10 YR | Since Inception |
|---|---|---|---|---|---|---|---|
| BUFFALO INTERNATIONAL FUND - Investor | 5.10 | 5.10 | -2.19 | 2.67 | 10.87 | 7.16 | 5.32 |
| BUFFALO INTERNATIONAL FUND - Institutional | 5.20 | 5.20 | -2.01 | 2.83 | 11.05 | 7.32 | 5.48 |
| FTSE All World Ex-US Index | 5.05 | 5.05 | 6.65 | 4.98 | 11.67 | 5.62 | 3.40 |
| Lipper International Fund Index | 6.66 | 6.66 | 6.22 | 6.06 | 12.38 | 5.72 | 3.50 |
| 2013 | 2014 | 2015 | 2016 | 2017 | 2018 | 2019 | 2020 | 2021 | 2022 | 2023 | 2024 | |
|---|---|---|---|---|---|---|---|---|---|---|---|---|
| BUFFALO INTERNATIONAL FUND - Investor | 19.29 | -2.04 | -0.45 | 3.19 | 29.33 | -8.85 | 28.02 | 19.10 | 18.21 | -21.79 | 18.33 | -1.88 |
| BUFFALO INTERNATIONAL FUND - Institutional | 19.46 | -1.89 | -0.30 | 3.34 | 29.53 | -8.71 | 28.20 | 19.24 | 18.42 | -21.65 | 18.47 | -1.75 |
| FTSE All World Ex-US Index | 15.62 | -3.04 | -4.46 | 5.12 | 27.47 | -13.87 | 22.20 | 11.52 | 8.66 | -15.22 | 16.20 | 6.13 |
| BUFIX vs FTSE All World Ex-US Index (As of 3/31/25) | |
|---|---|
| Upside Capture | 116.25 |
| Downside Capture | 117.22 |
| Alpha | -2.37 |
| Beta | 1.11 |
| Sharpe Ratio | -0.09 |
| (As of 3/31/25) | |
|---|---|
| # of Holdings | 69 |
| Median Market Cap | $57.91 B |
| Weighted Average Market Cap | $104.26 B |
| 3-Yr Annualized Turnover Ratio | 6.50% |
| Active Share | 90.63% |
As of 3/31/25. Market Cap percentages may not equal 100% due to rounding.
| Name of Holding | Ticker | Country | Sector | % of Net Assets |
|---|---|---|---|---|
| Taiwan Semiconductor Manufacturing Co., Ltd. | TSM | Taiwan | Information Technology | 3.37 |
| Schneider Electric SE | SU-FR | France | Industrials | 2.60 |
| SAP SE | SAP | Germany | Information Technology | 2.42 |
| BayCurrent Consulting, Inc. | 6532-JP | Japan | Industrials | 2.35 |
| MercadoLibre, Inc. | MELI | Argentina | Consumer Discretionary | 2.33 |
| GFL Environmental, Inc. | GFL | Canada | Industrials | 2.26 |
| Lonza Group AG | LONN | Switzerland | Health Care | 2.18 |
| Adyen NV | ADYEN | Netherlands | Information Technology | 2.12 |
| Linde PLC | LIN | Switzerland | Materials | 1.95 |
| Kerry Group PLC | KYGA | Ireland | Consumer Staples | 1.94 |
| TOP 10 HOLDINGS TOTAL | 23.53% | |||
As of 3/31/25. Security weightings are subject to change and are not recommendations to buy or sell any securities. Sector Allocation may not equal 100% due to rounding.
| TOP 10 COUNTRIES | % of Portfolio Net Assets |
|---|---|
| France | 15.71 |
| United Kingdom | 14.21 |
| Japan | 12.53 |
| Germany | 11.10 |
| Switzerland | 10.18 |
| Ireland | 9.41 |
| Netherlands | 6.26 |
| Canada | 5.31 |
| Denmark | 2.63 |
| Brazil | 2.45 |
| TOP 10 TOTAL | 89.79% |
| MARKET CLASSIFICATION | |
|---|---|
| Emerging Markets: | 8.12% |
| Developed Markets: | 91.88% |


| Buffalo International Fund Documents | Last Updated |
|---|---|
| Fact Sheet | 3/31/25 |
| Quarterly Q&A | 3/31/25 |
| Full Fund Holdings | 12/31/24 |
| Prospectus | 7/29/24 |
| Statement of Additional Information | 7/29/24 |
| Annual Report | 3/31/24 |
| Semi-Annual Report | 9/30/23 |
| Tax Guide - 2023 | 1/8/24 |
We get to know the companies we invest in and learn how they run their business.
We identify Top-Down broad, secular growth trends and search for companies from the Bottom-Up.
We construct our portfolios based on our own proprietary investment strategy.
Sticking to our disciplined investment strategy ensures we maintain a consistent, balanced approach.
The Morningstar Rating™ for funds, or "star rating", is calculated for managed products (including mutual funds, variable annuity and variable life subaccounts, exchange-traded funds, closed-end funds, and separate accounts) with at least a three-year history. Exchange-traded funds and open-ended mutual funds are considered a single population for comparative purposes. It is calculated based on a Morningstar Risk-Adjusted Return measure that accounts for variation in a managed product's monthly excess performance, placing more emphasis on downward variations and rewarding consistent performance. The Morningstar Rating does not include any adjustment for sales loads. The top 10% of products in each product category receive 5 stars, the next 22.5% receive 4 stars, the next 35% receive 3 stars, the next 22.5% receive 2 stars, and the bottom 10% receive 1 star. The Overall Morningstar Rating™ for a managed product is derived from a weighted average of the performance figures associated with its three-, five-, and 10-year (if applicable) Morningstar Rating™ metrics. The weights are: 100% three-year rating for 36-59 months of total returns, 60% five-year rating/40% three-year rating for 60-119 months of total returns, and 50% 10-year rating/30% five-year rating/20% three-year rating for 120 or more months of total returns. While the 10-year overall star rating formula seems to give the most weight to the 10-year period, the most recent three-year period actually has the greatest impact because it is included in all three rating periods.
©2024 Morningstar, Inc. All Rights Reserved. The information contained herein: (1) is proprietary to Morningstar; (2) may not be copied or distributed; and (3) is not warranted to be accurate, complete or timely. Neither Morningstar nor its content providers are responsible for any damages or losses arising from any use of this information. Past performance is no guarantee of future results.
The Buffalo International Fund (BUFIX) received 3 stars among 369 for the 3-year, 3 stars among 335 for the 5-year, and 4 stars among 213 Foreign Large Growth funds for the 10-year period ending 3/31/25. Other share classes may have different performance characteristics based on risk-adjusted returns.

| Investor | Institutional | |
| Ticker: | BUFEX | BUIEX |
| Daily Pricing: | ||
| As of 5/9/2025 | ||
| NAV: | $51.06 | $51.46 |
| $ Change: | $-0.11 | $-0.11 |
| % Change: |
-0.21% | -0.21% |
| YTD: |
-5.41% | -5.35% |
| Inception Date: | 5/19/1995 | 7/1/2019 |
| Expense Ratio: | 0.89% | 0.79% |
| Total Net Assets: | $137.51 Million (3/31/25) | |
| Morningstar Category: | Large Cap Growth | |
| Benchmark Index: | Russell 1000 Growth | |
|
Related Material: Fund Fact Sheet Q1 2025 PM Commentary Q1 2025 |
||
The investment objective of the Buffalo Blue Chip Growth Fund is long-term growth of capital. The Fund normally invests in equity securities, consisting of common stocks, preferred stocks, convertible securities, warrants and rights of large capitalization (“large-cap”) companies. The Fund considers a company to be a large-cap company if, at time of purchase by the Fund, it has a market capitalization greater than or equal to the lesser of (1) $10 billion, or (2) the median market capitalization of the Russell 1000 Growth Index. The median market capitalization of the Russell 1000 Growth Index changes due to market conditions and also changes with the composition of the Index.
The Fund managers seek to identify companies for the Fund’s portfolio that are expected to experience growth based on the identification of long-term, measurable secular trends, and which, as a result, the managers believe may have potential revenue growth in excess of the gross domestic product growth rate.
Companies are screened using in-depth, in-house research to identify those which the managers believe have favorable attributes, including attractive valuation, strong management, conservative debt, free cash flow, scalable business models, and competitive advantages.
We don’t manage to our benchmark so we don’t have too much concentration in any one single trend. We also manage based on valuation, trimming positions when they approach their potential upside and adding to them as they get closer to the potential downside.
Ken Laudan, Portfolio Manager
Overall Morningstar Rating™ of BUFEX based on risk-adjusted returns among 1,027 Large Growth funds as of 3/31/25.
| As of 3/31/25 | 3 MO | YTD | 1 YR | 3 YR | 5 YR | 10 YR | 15 YR | 20 YR | Since Inception |
|---|---|---|---|---|---|---|---|---|---|
| BUFFALO BLUE CHIP GROWTH FUND - Investor | -8.24 | -8.24 | 5.05 | 9.51 | 17.81 | 12.81 | 13.10 | 10.68 | 10.54 |
| BUFFALO BLUE CHIP GROWTH FUND - Institutional | -8.18 | -8.18 | 5.20 | 9.65 | 17.98 | 12.98 | 13.26 | 10.85 | 10.70 |
| Russell 1000 Growth Index | -10.00 | -10.00 | 7.72 | 10.09 | 20.08 | 15.12 | 15.29 | 12.20 | 10.76 |
| Lipper Large Cap Growth Fund Index | -9.43 | -9.43 | 4.65 | 8.84 | 17.50 | 13.30 | 13.52 | 10.74 | 9.49 |
| 2013 | 2014 | 2015 | 2016 | 2017 | 2018 | 2019 | 2020 | 2021 | 2022 | 2023 | 2024 | |
|---|---|---|---|---|---|---|---|---|---|---|---|---|
| BUFFALO BLUE CHIP GROWTH FUND - Investor | 32.76 | 12.76 | 7.15 | 6.90 | 24.86 | -1.63 | 31.77 | 28.08 | 26.08 | -28.61 | 40.39 | 28.87 |
| BUFFALO BLUE CHIP GROWTH FUND - Institutional | 32.96 | 12.92 | 7.31 | 7.06 | 25.05 | -1.48 | 31.98 | 28.28 | 26.27 | -28.51 | 40.52 | 29.03 |
| Russell 1000 Growth Index | 33.48 | 13.05 | 5.67 | 7.08 | 30.21 | -1.51 | 36.39 | 38.49 | 27.60 | -29.14 | 42.68 | 33.36 |
| BUFEX vs Russell 1000 Growth Index (As of 3/31/25) | |
|---|---|
| Upside Capture | 87.13 |
| Downside Capture | 93.39 |
| Alpha | 0.19 |
| Beta | 0.91 |
| Sharpe Ratio | 0.28 |
| (As of 3/31/25) | |
|---|---|
| # of Holdings | 79 |
| Median Market Cap | $145.4 B |
| Weighted Average Market Cap | $1333.1 B |
| 3-Yr Annualized Turnover Ratio | 33.75% |
| % of Holdings with Free Cash Flow | 88.75% |
| Active Share | 34.94% |
| Name of Holding | Ticker | Sector | % of Net Assets |
|---|---|---|---|
| Apple, Inc. | AAPL | Information Technology | 10.46 |
| NVIDIA Corporation | NVDA | Information Technology | 9.72 |
| Microsoft Corporation | MSFT | Information Technology | 9.26 |
| Amazon.com, Inc. | AMZN | Consumer Discretionary | 6.62 |
| Alphabet, Inc. | GOOGL | Communication Services | 6.16 |
| Meta Platforms, Inc. | META | Communication Services | 4.34 |
| Broadcom, Inc. | AVGO | Information Technology | 2.91 |
| Visa, Inc. | V | Financials | 2.06 |
| Eli Lilly and Company | LLY | Health Care | 1.96 |
| Costco Wholesale Corporation | COST | Consumer Staples | 1.56 |
| TOP 10 HOLDINGS TOTAL | 55.05% | ||
As of 3/31/25. Security weightings are subject to change and are not recommendations to buy or sell any securities. Sector Allocation may not equal 100% due to rounding.
As of 3/31/25. Market Cap percentages may not equal 100% due to rounding.
The opinions expressed are those of the Portfolio Manager(s) and are subject to change, are not guaranteed and should not be considered recommendations to buy or sell any security. Earnings growth is not representative of the fund’s future performance.
| Buffalo Blue Chip Growth Fund Documents | Last Updated |
|---|---|
| Fact Sheet | 3/31/25 |
| Quarterly Commentary | 3/31/25 |
| Full Fund Holdings | 12/31/24 |
| Prospectus | 7/29/24 |
| Statement of Additional Information | 7/29/24 |
| Annual Report | 3/31/24 |
| Semi-Annual Report | 9/30/23 |
| Tax Guide - 2023 | 1/8/24 |
We get to know the companies we invest in and learn how they run their business.
We identify Top-Down broad, secular growth trends and search for companies from the Bottom-Up.
We construct our portfolios based on our own proprietary investment strategy.
Sticking to our disciplined investment strategy ensures we maintain a consistent, balanced approach.
The Morningstar Rating™ for funds, or "star rating", is calculated for managed products (including mutual funds, variable annuity and variable life subaccounts, exchange-traded funds, closed-end funds, and separate accounts) with at least a three-year history. Exchange-traded funds and open-ended mutual funds are considered a single population for comparative purposes. It is calculated based on a Morningstar Risk-Adjusted Return measure that accounts for variation in a managed product's monthly excess performance, placing more emphasis on downward variations and rewarding consistent performance. The Morningstar Rating does not include any adjustment for sales loads. The top 10% of products in each product category receive 5 stars, the next 22.5% receive 4 stars, the next 35% receive 3 stars, the next 22.5% receive 2 stars, and the bottom 10% receive 1 star. The Overall Morningstar Rating™ for a managed product is derived from a weighted average of the performance figures associated with its three-, five-, and 10-year (if applicable) Morningstar Rating™ metrics. The weights are: 100% three-year rating for 36-59 months of total returns, 60% five-year rating/40% three-year rating for 60-119 months of total returns, and 50% 10-year rating/30% five-year rating/20% three-year rating for 120 or more months of total returns. While the 10-year overall star rating formula seems to give the most weight to the 10-year period, the most recent three-year period actually has the greatest impact because it is included in all three rating periods.
©2024 Morningstar, Inc. All Rights Reserved. The information contained herein: (1) is proprietary to Morningstar; (2) may not be copied or distributed; and (3) is not warranted to be accurate, complete or timely. Neither Morningstar nor its content providers are responsible for any damages or losses arising from any use of this information. Past performance is no guarantee of future results.
The Buffalo Blue Chip Growth Fund received 4 stars among 1,027 for the 3-year, 4 stars among 949 for the 5-year, and 4 stars among 745 Large Growth funds for the 10-year period ending 3/31/25. Other share classes may have different performance characteristics.

| Investor | Institutional | |
| Ticker: | BUFMX | BUIMX |
| Daily Pricing: | ||
| As of 5/9/2025 | ||
| NAV: | $15.92 | $16.08 |
| $ Change: | $-0.06 | $-0.06 |
| % Change: |
-0.38% | -0.37% |
| YTD: |
-2.39% | -2.31% |
| Inception Date: | 12/17/2001 | 7/1/2019 |
| Expense Ratio: | 0.97% | 0.87% |
| Total Net Assets: | $134.67 Million (3/31/25) | |
| Morningstar Category: | Mid Cap Growth | |
| Benchmark Index: | Russell Midcap Growth | |
|
Related Material: Fund Fact Sheet Q1 2025 PM Commentary Q1 2025 |
||
The investment objective of the Buffalo Mid Cap Growth Fund is long-term growth of capital. The Fund normally invests at least 80% of its net assets in equity securities, consisting of common stocks, preferred stocks, convertible preferred stocks, warrants and rights of medium capitalization (“mid-cap”) companies. The Fund defines mid-cap companies as those companies that, at the time of purchase, have market capitalizations within the range of the Russell Midcap Growth Index.
The Fund managers seek to identify companies for the Mid Cap Fund’s portfolio that are expected to experience growth based on the identification of long-term, measurable secular trends, and which, as a result, the managers believe may have potential revenue growth in excess of the gross domestic product growth rate. Companies are screened using in-depth, in-house research to identify those which the managers believe have favorable attributes, including attractive valuation, strong management, conservative debt, free cash flow, scalable business models, and competitive advantages.
Our focus has always been on investing in secular growth companies we believe are attractively-priced with strong balance sheets. We remain convinced the inefficiencies inherent in the small and mid-cap market spectrum, in addition to where we are in the economic cycle, are best suited for disciplined, active management of the portfolio.
Josh West, Portfolio Manager
Overall Morningstar Rating™ of BUFMX based on risk-adjusted returns among 481 Mid-Cap Growth funds as of 3/31/25.
| As of 3/31/25 | 3 MO | YTD | 1 YR | 3 YR | 5 YR | 10 YR | 15 YR | 20 YR | Since Inception |
|---|---|---|---|---|---|---|---|---|---|
| BUFFALO MID CAP GROWTH FUND - Investor | -4.41 | -4.41 | -3.72 | 1.36 | 11.21 | 7.49 | 9.07 | 8.32 | 8.21 |
| BUFFALO MID CAP GROWTH FUND - Institutional | -4.31 | -4.31 | -3.57 | 1.49 | 11.38 | 7.65 | 9.23 | 8.48 | 8.37 |
| Russell Midcap Growth Index | -7.12 | -7.12 | 3.57 | 6.16 | 14.86 | 10.14 | 12.20 | 10.16 | 9.49 |
| Lipper Mid Cap Growth Index | -8.02 | -8.02 | -5.99 | -0.19 | 10.36 | 7.89 | 9.98 | 8.88 | 7.94 |
| 2013 | 2014 | 2015 | 2016 | 2017 | 2018 | 2019 | 2020 | 2021 | 2022 | 2023 | 2024 | |
|---|---|---|---|---|---|---|---|---|---|---|---|---|
| BUFFALO MID CAP GROWTH FUND - Investor | 29.25 | 5.85 | -0.52 | 5.93 | 13.66 | -7.30 | 37.98 | 34.18 | 14.61 | -27.80 | 26.97 | 6.79 |
| BUFFALO MID CAP GROWTH FUND - Institutional | 29.45 | 6.00 | -0.37 | 6.08 | 13.82 | -7.16 | 38.16 | 34.42 | 14.73 | -27.69 | 27.18 | 6.86 |
| Russell Midcap Growth Index | 35.74 | 11.90 | -0.20 | 7.33 | 25.27 | -4.75 | 35.47 | 35.59 | 12.73 | -26.72 | 25.87 | 22.10 |
For performance prior to 7/1/19 (Inception Date of Institutional Class), performance of the Investor Class shares is used and includes expenses not applicable and lower than those of Investor Class shares.Performance data quoted represents past performance; past performance does not guarantee future results. The investment return and principal value of an investment will fluctuate so that an investor’s shares, when redeemed, may be worth more or less than their original cost. Current performance of the fund may be lower of higher than the performance quoted and can be obtained here. Performance is annualized for periods greater than 1 year. Each Morningstar category average represents a universe of funds with similar objectives.
| BUFMX vs Russell Midcap Growth Index (As of 3/31/25) | |
|---|---|
| Upside Capture | 84.43 |
| Downside Capture | 102.48 |
| Alpha | -4.00 |
| Beta | 0.91 |
| Sharpe Ratio | -0.15 |
| (As of 3/31/25) | |
|---|---|
| # of Holdings | 50 |
| Median Market Cap | $22.65 B |
| Weighted Average Market Cap | $29.58 B |
| 3-Yr Annualized Turnover Ratio | 17.61% |
| % of Holdings with Free Cash Flow | 92.00% |
| Active Share | 88.18% |
| Name of Holding | Ticker | Sector | % of Net Assets |
|---|---|---|---|
| CBRE Group, Inc. | CBRE | Real Estate | 4.73 |
| MSCI, Inc. | MSCI | Financials | 4.50 |
| Gartner, Inc. | IT | Information Technology | 4.36 |
| Verisk Analytics, Inc. | VRSK | Industrials | 3.64 |
| Copart, Inc. | CPRT | Industrials | 3.34 |
| Kinsale Capital Group, Inc. | KNSL | Financials | 3.19 |
| TransUnion | TRU | Industrials | 3.15 |
| AMETEK, Inc. | AME | Industrials | 2.90 |
| Veeva Systems, Inc. | VEEV | Health Care | 2.89 |
| IQVIA Holdings, Inc. | IQV | Health Care | 2.81 |
| TOP 10 HOLDINGS TOTAL | 35.51% | ||
As of 3/31/25. Security weightings are subject to change and are not recommendations to buy or sell any securities. Sector Allocation may not equal 100% due to rounding.
As of 3/31/25. Market Cap percentages may not equal 100% due to rounding.


| Buffalo Mid Cap Growth Fund Documents | Last Updated |
|---|---|
| Fact Sheet | 3/31/25 |
| Quarterly Commentary | 3/31/25 |
| Full Fund Holdings | 12/31/24 |
| Prospectus | 7/29/24 |
| Statement of Additional Information | 7/29/24 |
| Annual Report | 3/31/24 |
| Semi-Annual Report | 9/30/23 |
| Tax Guide - 2023 | 1/8/24 |
We get to know the companies we invest in and learn how they run their business.
We identify Top-Down broad, secular growth trends and search for companies from the Bottom-Up.
We construct our portfolios based on our own proprietary investment strategy.
Sticking to our disciplined investment strategy ensures we maintain a consistent, balanced approach.
The Morningstar Rating™ for funds, or "star rating", is calculated for managed products (including mutual funds, variable annuity and variable life subaccounts, exchange-traded funds, closed-end funds, and separate accounts) with at least a three-year history. Exchange-traded funds and open-ended mutual funds are considered a single population for comparative purposes. It is calculated based on a Morningstar Risk-Adjusted Return measure that accounts for variation in a managed product's monthly excess performance, placing more emphasis on downward variations and rewarding consistent performance. The Morningstar Rating does not include any adjustment for sales loads. The top 10% of products in each product category receive 5 stars, the next 22.5% receive 4 stars, the next 35% receive 3 stars, the next 22.5% receive 2 stars, and the bottom 10% receive 1 star. The Overall Morningstar Rating™ for a managed product is derived from a weighted average of the performance figures associated with its three-, five-, and 10-year (if applicable) Morningstar Rating™ metrics. The weights are: 100% three-year rating for 36-59 months of total returns, 60% five-year rating/40% three-year rating for 60-119 months of total returns, and 50% 10-year rating/30% five-year rating/20% three-year rating for 120 or more months of total returns. While the 10-year overall star rating formula seems to give the most weight to the 10-year period, the most recent three-year period actually has the greatest impact because it is included in all three rating periods.
©2024 Morningstar, Inc. All Rights Reserved. The information contained herein: (1) is proprietary to Morningstar; (2) may not be copied or distributed; and (3) is not warranted to be accurate, complete or timely. Neither Morningstar nor its content providers are responsible for any damages or losses arising from any use of this information. Past performance is no guarantee of future results.
The Buffalo Mid Cap Growth Fund (BUFMX) received 3 stars among 481 for the 3-year, 3 stars among 447 for the 5-year, and 3 stars among 358 Mid-Cap Growth funds for the 10-year period ending 3/31/25. Other share classes may have different performance characteristics.

| Investor | Institutional | |
| Ticker: | BUFSX | BUISX |
| Daily Pricing: | ||
| As of 5/9/2025 | ||
| NAV: | $13.57 | $13.68 |
| $ Change: | $-0.08 | $-0.07 |
| % Change: |
-0.59% | -0.51% |
| YTD: |
-8.80% | -8.74% |
| Inception Date: | 4/14/1998 | 7/1/2019 |
| Expense Ratio: | 0.97% | 0.87% |
| Total Net Assets: | $505.72 Million (3/31/25) | |
| Morningstar Category: | Small Cap Growth | |
| Benchmark Index: | Russell 2000 Growth | |
|
Related Material: Fund Fact Sheet Q1 2025 PM Commentary Q1 2025 Portfolio Manager Q&A |
||
|
An actively-managed portfolio of smaller-capitalization, rapidly-growing companies that can benefit from positive, long-term trends remains an excellent way to exploit an inefficient market.
Bob Male, Portfolio Manager
Overall Morningstar Rating™ of BUFSX based on risk-adjusted returns among 535 Small Growth funds as of 3/31/25.
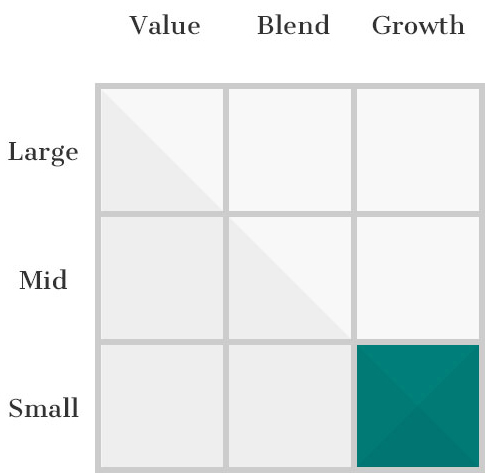
The investment objective of the Buffalo Small Cap Growth Fund is long-term growth of capital. The Small Cap Fund normally invests at least 80% of its net assets in equity securities, consisting of common stocks, preferred stocks, convertible preferred stocks, warrants and rights of small capitalization (“small-cap”) companies. The Small Cap Growth Fund defines small-cap companies as those that, at the time of purchase, have market capitalizations within the range of the Russell 2000 Growth Index.
The Fund managers seek to identify companies for the Fund’s portfolio that are expected to experience growth based on the identification of long-term, measurable secular trends, and which, as a result, the managers believe may have potential revenue growth in excess of the gross domestic product growth rate. Companies are screened using in-depth, in-house research to identify those which the managers believe have attractive valuation, strong management, conservative debt, free cash flow, scalable business models, and competitive advantages.
| As of 3/31/25 | 3 MO | YTD | 1 YR | 3 YR | 5 YR | 10 YR | 15 YR | 20 YR | Since Inception |
|---|---|---|---|---|---|---|---|---|---|
| BUFFALO SMALL CAP GROWTH FUND - Investor | -9.88 | -9.88 | -8.96 | -5.93 | 8.83 | 7.26 | 8.49 | 7.78 | 10.30 |
| BUFFALO SMALL CAP GROWTH FUND - Institutional | -9.87 | -9.87 | -8.96 | -5.85 | 8.96 | 7.40 | 8.64 | 7.93 | 10.46 |
| Russell 2000 Growth Index | -11.12 | -11.12 | -4.86 | 0.78 | 10.78 | 6.14 | 9.51 | 8.06 | 5.92 |
| Lipper Small Cap Growth Fund Index | -9.52 | -9.52 | -4.60 | 0.50 | 12.49 | 8.02 | 10.22 | 8.29 | 7.05 |
| Year | 2013 | 2014 | 2015 | 2016 | 2017 | 2018 | 2019 | 2020 | 2021 | 2022 | 2023 | 2024 |
|---|---|---|---|---|---|---|---|---|---|---|---|---|
| BUFFALO SMALL CAP GROWTH FUND - Investor | 44.15 | -6.55 | -4.46 | 6.22 | 27.07 | -5.78 | 40.97 | 66.36 | 4.85 | -30.01 | 5.45 | 5.38 |
| BUFFALO SMALL CAP GROWTH FUND - Institutional | 44.36 | -6.41 | -4.32 | 6.37 | 27.26 | -5.64 | 41.17 | 66.60 | 4.97 | -29.88 | 5.57 | 5.41 |
| Russell 2000 Growth Index | 43.30 | 5.60 | -1.38 | 11.32 | 22.17 | -9.31 | 28.48 | 34.63 | 2.83 | -26.36 | 18.66 | 15.15 |
| BUFSX vs Russell 2000 Growth Index (As of 3/31/24) | |
|---|---|
| Upside Capture | 75.76 |
| Downside Capture | 102.11 |
| Alpha | -6.64 |
| Beta | 0.94 |
| Sharpe Ratio | -0.46 |
This chart illustrates the performance of a hypothetical $10,000 investment made in the Fund on the Inception Date. Assumes reinvestment of dividends and capital gains. This chart does not imply future performance.
| (As of 3/31/25) | |
|---|---|
| # of Holdings | 69 |
| Median Market Cap | $4.36 B |
| Weighted Average Market Cap | $4.88 B |
| 3-Yr Annualized Turnover Ratio | 31.22% |
| % of Holdings with Free Cash Flow | 83.58% |
| Active Share | 89.96% |
| Name of Holding | Ticker | Sector | % of Net Assets |
|---|---|---|---|
| Shift4 Payments, Inc. | FOUR | Financials | 3.21 |
| Summit Materials, Inc. | SUM | Materials | 3.10 |
| Vertex, Inc. | VERX | Information Technology | 2.83 |
| Chart Industries, Inc. | GTLS | Industrials | 2.48 |
| Ligand Pharmaceuticals, Inc. | LGND | Health Care | 2.44 |
| Hamilton Lane, Inc. | HLNE | Financials | 2.42 |
| Palomar Holdings, Inc. | PLMR | Financials | 2.31 |
| Champion Homes, Inc. | SKY | Consumer Discretionary | 2.30 |
| John Bean Technologies Corporation | JBTM | Industrials | 2.17 |
| ICF International, Inc. | ICFI | Industrials | 1.99 |
| TOP 10 HOLDINGS TOTAL | 25.24% | ||
As of 3/31/25. Security weightings are subject to change and are not recommendations to buy or sell any securities. Sector Allocation may not equal 100% due to rounding.
As of 3/31/25. Market Cap percentages may not equal 100% due to rounding.


| Buffalo Small Cap Growth Fund Documents | Last Updated |
|---|---|
| Fact Sheet | 3/31/25 |
| Quarterly Commentary | 3/31/25 |
| Full Fund Holdings | 12/31/24 |
| Prospectus | 7/29/24 |
| Statement of Additional Information | 7/29/24 |
| Annual Report | 3/31/24 |
| Semi-Annual Report | 9/30/23 |
| Tax Guide - 2023 | 1/8/24 |
We get to know the companies we invest in and learn how they run their business.
We identify Top-Down broad, secular growth trends and search for companies from the Bottom-Up.
We construct our portfolios based on our own proprietary investment strategy.
Sticking to our disciplined investment strategy ensures we maintain a consistent, balanced approach.
The Morningstar Rating™ for funds, or "star rating", is calculated for managed products (including mutual funds, variable annuity and variable life subaccounts, exchange-traded funds, closed-end funds, and separate accounts) with at least a three-year history. Exchange-traded funds and open-ended mutual funds are considered a single population for comparative purposes. It is calculated based on a Morningstar Risk-Adjusted Return measure that accounts for variation in a managed product's monthly excess performance, placing more emphasis on downward variations and rewarding consistent performance. The top 10% of products in each product category receive 5 stars, the next 22.5% receive 4 stars, the next 35% receive 3 stars, the next 22.5% receive 2 stars, and the bottom 10% receive 1 star. The Overall Morningstar Rating™ for a managed product is derived from a weighted average of the performance figures associated with its three-, five-, and 10-year (if applicable) Morningstar Rating™ metrics. The weights are: 100% three-year rating for 36-59 months of total returns, 60% five-year rating/40% three-year rating for 60-119 months of total returns, and 50% 10-year rating/30% five-year rating/20% three-year rating for 120 or more months of total returns. While the 10-year overall star rating formula seems to give the most weight to the 10-year period, the most recent three-year period actually has the greatest impact because it is included in all three rating periods.
The Buffalo Small Cap Growth Fund (BUFSX) received 2 stars among 535 for the 3-year, 2 stars among 520 for the 5-year, and 3 stars among 395 Small Growth funds for the 10-year period ending 3/31/25, based on risk-adjusted returns.
Diversification does not assure a profit, nor does it protect against a loss in a declining market.
Active investing has higher management fees because of the manager’s increased level of involvement while passive investing has lower management and operating fees. Investing in both actively and passively managed mutual funds involves risk and principal loss is possible. Both actively and passively managed mutual funds generally have daily liquidity. There are no guarantees regarding the performance of actively and passively managed mutual funds. Actively managed mutual funds may have higher portfolio turnover than passively managed funds. Excessive turnover can limit returns and can incur capital gains.

Buffalo Funds Flexible Income portfolio manager John Kornitzer was recently interviewed by Investor’s Business Daily (IBD) where he discusses a variety of topics including stock market risks in 2023, rising interest rates, and the energy sector. He also cites several examples of companies within the Fund’s portfolio that highlight his investment strategy at work:
The page you requested could not be found. Try refining your search, or use the navigation above to locate the post.
“Energy prices could spike or maybe come down. If they spike, it adds to the problem of (potential) recession. If they stay up, we could see lots of defaults and bankruptcies. It’s a tightrope.“
~ John Kornitzer, Portfolio Manager, Buffalo Flexible Income Fund
Past performance does not guarantee future results. Earnings growth is not representative of the Fund’s future performance. Performance data quoted represents past performance and does not guarantee future results. The investment return and principal value of an investment will fluctuate so that an investor’s shares, when redeemed, may be worth more or less than their original cost. Current performance may be lower or higher than the performance quoted. Standardized performance can be obtained here.
Opinions expressed are those of the author or Fund as of 11/18/22 and are subject to change, are not intended to be a forecast of future events, a guarantee of future results, nor investment advice. A complete list of the Fund’s holdings can be found here. Fund holdings and sector allocations are subject to change and should not be considered a recommendation to buy or sell any security.
Stay up-to-date with the most recent media coverage and press releases about the Buffalo Funds.
Buffalo Funds High Yield portfolio manager Paul Dlugosch recently appeared on the “Money Life with Chuck Jaffe” podcast.
During the call, Paul discusses how current high-inflation and rising-rate environment affects the high-yield bond market. He also goes in-depth on the quality and strength of corporate earnings being a significant determinant of whether the junk-bond market can recover or if it will face troubles that linger to 2023 and beyond. Paul also provides an overview of his investment methodology, his thoughts on investing in energy companies in general, and his thoughts on Teva Pharmaceutical (NYSE: TEVA) and Bausch Health (NYSE: BHC).
Paul Dlugosh, CFA
Portfolio Manager
25 Years of Experience
View full bio
Opinions expressed are those of the author or Funds as of 5/16/22 and are subject to change, are not intended to be a forecast of future events, a guarantee of future results, nor investment advice. A full listing of the Buffalo High Yield Fund portfolio holdings can be found here. Past performance does not guarantee future results.
Cash flow is a measure of the cash produced by the firm in a given period on behalf of equity holders. The true measure of the value of a firm’s equity is considered to be the present value of all free cash flows. Correlation measures the degree to which two variables move in relation to each other, for example the movement of a stock with that of a benchmark index.
Overall Morningstar Rating™ of BUFHX is 5 stars based on risk-adjusted returns among 632 High Yield Bond funds as of 4/30/22. The Morningstar Rating™ for funds, or “star rating”, is calculated for managed products (including mutual funds, variable annuity and variable life subaccounts, exchange-traded funds, closed-end funds, and separate accounts) with at least a three-year history. Exchange-traded funds and open-ended mutual funds are considered a single population for comparative purposes. It is calculated based on a Morningstar Risk-Adjusted Return measure that accounts for variation in a managed product’s monthly excess performance, placing more emphasis on downward variations and rewarding consistent performance. The top 10% of products in each product category receive 5 stars, the next 22.5% receive 4 stars, the next 35% receive 3 stars, the next 22.5% receive 2 stars, and the bottom 10% receive 1 star. The Overall Morningstar Rating™ for a managed product is derived from a weighted average of the performance figures associated with its 3-, 5-, and 10-year (if applicable) Morningstar Rating™ metrics. The weights are: 100% 3-year rating for 36-59 months of total returns, 60% 5-year rating/40% 3-year rating for 60-119 months of total returns, and 50% 10-year rating/30% 5-year rating/20% 3-year rating for 120 or more months of total returns. While the 10-year overall star rating formula seems to give the most weight to the 10-year period, the most recent 3-year period actually has the greatest impact because it is included in all 3 rating periods. The Buffalo High Yield Fund (BUFHX) received 5 stars among 632 for the 3-year, 5 stars among 575 for the 5-year, and 4 stars among 381 High Yield Bond funds for the 10-year period ending 4/30/22. © 2022 Morningstar, Inc. All Rights Reserved. The information contained herein: (1) is proprietary to Morningstar; (2) may not be copied or distributed; and (3) is not warranted to be accurate, complete or timely. Neither Morningstar nor its content providers are responsible for any damages or losses arising from any use of this information. Past performance is no guarantee of future results.
As of 12/31/21 the Buffalo High Yield Fund top 10 holdings were Northern Oil & Gas (8.125%, 3/1/28) 3.01%, DirecTV Financing (1 Month LIBOR + 5.000%, 8/2/27) 2.66%, MPLX (6.875%, 8/15/23) 2.34%, Penn Virginia Escrow (9.250%, 8/15/26) 2.07%, Consol Energy (11.000%, 11/15/25) 2.06%, Matador Resources (5.875%, 9/15/26) 1.88%, Energy Transfer (7.125%, perpetual preferred) 1.69%, PetIQ (3 Month LIBOR + 4.250%, 4/7/28) 1.65%, Magnite (6 Month LIBOR + 5.000%, 4/3/28) 1.48%, Talos Production (12.000%, 1/15/26) 1.43%. Top 10 holdings for the quarter are not disclosed until 60 days after quarter end. Fund holdings are subject to change and are not recommendations to buy or sell any securities.
Stay up-to-date with the most recent media coverage and press releases about the Buffalo Funds.