No Results Found
The page you requested could not be found. Try refining your search, or use the navigation above to locate the post.

Home > Insights & News > White Papers & Research > Industry Perspectives 3Q 2017
“If multiple central banks throughout the world embark on drawing down their balance sheet in the same manner as the U.S., interest rates could be pressured to go higher.”
Clay Brethour, President, Buffalo Funds
OVERVIEW:
The equity markets continued their upward trajectory during the 3rd quarter, with most market indices closing the quarter at an all-time high, or close to their record highs. This defies the well-known trading adage of “sell in May and go away” that warns investors to sell their equity holdings in May to avoid the typical volatile Summer months and come back in the Fall.
Why is it taking so long for interest rates to increase? From a monetary policy perspective, moving too quickly could slow growth unnecessarily, but raising rates too gradually could create an inflationary problem down the road that might be difficult to overcome without triggering a recession.
We get to know the companies we invest in and learn how they run their business.
We identify Top-Down broad, secular growth trends and search for companies from the Bottom-Up.
We construct our portfolios based on our own proprietary investment strategy.
Sticking to our disciplined investment strategy ensures we maintain a consistent, balanced approach.
Stay up-to-date with the most recent media coverage and press releases about the Buffalo Funds.

Discover in-depth insights on current and prospective trends from the viewpoint of our international portfolio managers.
Over the past 9 months, we have detected a change in market leadership, as international equities have started to outperform their domestic counterparts. In this latest report, learn why now might be the time to rethink your international equity exposure and possibly increase your international allocation levels.
The portfolio managers of the Buffalo International Fund go in-depth on current and prospective trends that investors and their advisers should be aware of when examining their investment strategy.
In this report, we cover:
Discover how our International Fund portfolio managers, who operate within the international equity asset classes on a daily basis, view today’s international markets. See for yourself why we believe now is the time for investors to rethink international equity exposure and consider increasing international stock allocations.

We get to know the companies we invest in and learn how they run their business.
We identify Top-Down broad, secular growth trends and search for companies from the Bottom-Up.
We construct our portfolios based on our own proprietary investment strategy.
Sticking to our disciplined investment strategy ensures we maintain a consistent, balanced approach.
The Morningstar Rating™ for funds, or "star rating", is calculated for managed products (including mutual funds, variable annuity and variable life subaccounts, exchange-traded funds, closed-end funds, and separate accounts) with at least a three-year history. Exchange-traded funds and open-ended mutual funds are considered a single population for comparative purposes. It is calculated based on a Morningstar Risk-Adjusted Return measure that accounts for variation in a managed product's monthly excess performance, placing more emphasis on downward variations and rewarding consistent performance. The top 10% of products in each product category receive 5 stars, the next 22.5% receive 4 stars, the next 35% receive 3 stars, the next 22.5% receive 2 stars, and the bottom 10% receive 1 star. The Overall Morningstar Rating™ for a managed product is derived from a weighted average of the performance figures associated with its three-, five-, and 10-year (if applicable) Morningstar Rating™ metrics. The weights are: 100% three-year rating for 36-59 months of total returns, 60% five-year rating/40% three-year rating for 60-119 months of total returns, and 50% 10-year rating/30% five-year rating/20% three-year rating for 120 or more months of total returns. While the 10-year overall star rating formula seems to give the most weight to the 10-year period, the most recent three-year period actually has the greatest impact because it is included in all three rating periods.
The Buffalo International Fund received 4 stars among 325 for the 3-year, 4 stars among 280 for the 5-year, and 5 stars among 192 Foreign Large Growth funds for the 10-year period ending 9/30/17.
©2017 Morningstar, Inc. All Rights Reserved. The information contained herein: (1) is proprietary to Morningstar; (2) may not be copied or distributed; and (3) is not warranted to be accurate, complete or timely. Neither Morningstar nor its content providers are responsible for any damages or losses arising from any use of this information. Past performance is no guarantee of future results.
Click here for current ratings of the Buffalo Funds.
The Overall Morningstar Rating™ for a managed product is derived from a weighted average of the performance figures associated with its three-, five-, and 10-year (if applicable) Morningstar Rating™ metrics.
While the U.S. News Mutual Fund Score combines all five equally weighted category scores to achieve its weighting, Lipper intends its measures to be used as individual assessments of a fund's ability to meet specific goals, rather than as a cumulative measure of fund quality. Lipper rankings are comprised of five unique measures (Total Return, Consistent Return, Preservation, Expense, and Tax Efficiency), each with a 1-to-5 score, ranking each fund against its peers. The highest 20% of funds in each peer group are named Lipper Leaders, the next 20% receive a rating of 4, the middle 20% are rated 3, the next 20% are rated 2, and the lowest 20% are rated 1. The overall calculation is based on an equal-weighted average of percentile ranks for each measure over three-, five-, and ten-year periods (if applicable). Lipper Ratings for Total Return reflect funds’ historical total return performance relative to peers. Lipper Ratings for Consistent Return reflect funds’ historical risk-adjusted returns, relative to peers. Lipper Ratings for Preservation reflect funds’ historical loss avoidance relative to other funds within the same asset class. Lipper Ratings for Tax Efficiency reflect funds’ historical success in postponing taxable distributions relative to peers. Lipper Ratings for Expense reflect funds’ expense minimization relative to peers with similar load structures.
The Zacks Mutual Fund Rank ranks funds on a scale from 1 to 5, with 1 being a Strong Buy and 5 being a Strong Sell. Each quarter, Zacks updates their Mutual Fund Rank by evaluating the average Zacks Rank for the stocks owned by the fund and blending this with other criteria their studies show is beneficial in finding funds that will outperform in the future. In general, the higher the average Zacks Rank for the stocks in the fund, then the higher the Zacks Mutual Fund Rank.
TheStreet.com Ratings Investment Ratings for Funds condense the available fund performance and risk data into a single composite opinion of each fund's risk-adjusted performance. “A (Buy) Excellent” rating means the fund has an excellent track record of maximizing performance while minimizing risk, thus delivering the best possible combination of total return on investment and reduced volatility. “B (Buy) Good” rating means the fund has a good track record of balancing performance with risk. “C (Hold) Fair” rating ratings means the fund has a track record which is about average. “D (Sell) Weak” rating means the fund has underperformed the universe of other funds given the level of risk in its underlying investments, resulting in a weak risk-adjusted performance. “E (Sell) Very Weak” rating means the fund has significantly underperformed most other funds given the level of risk in its underlying investments, resulting in a very weak risk-adjusted performance. The plus sign (+) is an indication that the fund is in the top third of its letter grade. The minus sign (-) is an indication that the fund is in the bottom third of its letter grade. “U Unrated” rating means the fund does not have sufficient history to make a reliable assessment of its risk-adjusted performance.
The CFRA Rankings range from five-star (highest) to one-star (lowest) and follow a normalized distribution curve, based upon the fund’s rank in its Category. Top 10% receive five stars, next 20% receive four stars, middle 40% receive three stars, next 20% receive two stars, and the bottom 10% receive one star. Rankings are refreshed on a weekly basis to incorporate the latest inputs from the holdings-based analysis and the latest relative performance review.
Performance data quoted represents past performance; past performance does not guarantee future results. The investment return and principal value of an investment will fluctuate so that an investor’s shares, when redeemed may be worth more or less than their original value. Current performance may be lower or higher than the performance quoted. Performance data current to the most recent month-end may be obtained here. Performance data current to the most recent quarter-end may be obtained here.
Opinions expressed are those of the author or Funds and are subject to change, are not intended to be a forecast of future events, a guarantee of future results, nor investment advice.
References to other mutual funds should not to be considered an offer to buy or sell these securities.
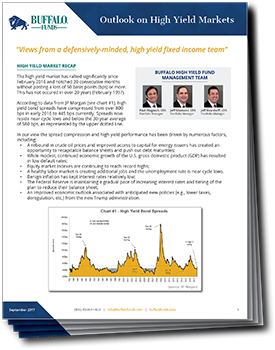
Insights from the defensively-minded, high yield fixed income team of Buffalo High Yield Fund portfolio managers
The high yield market (as measured by the BofA Merrill Lynch HY Master II Index) has rallied significantly since February 2016 and notched 20 consecutive months without posting a loss of 50 basis points (bps) or more, something that hasn’t occurred in over 20 years. In this latest report, the portfolio managers of the Buffalo High Yield Fund identify several factors that have driven spread compression and high yield performance in the market.
Areas covered in this report include:
As a defensively-minded, high yield fixed income team, the Buffalo High Yield Fund portfolio managers follow a more cautious investment philosophy, with the goal of producing compelling risk-adjusted performance over a full market cycle.

Past performance is not a guarantee of future results. Index performance is not illustrative of fund performance. It is not possible to invest directly in an index. Please click here for fund performance.
We get to know the companies we invest in and learn how they run their business.
We identify Top-Down broad, secular growth trends and search for companies from the Bottom-Up.
We construct our portfolios based on our own proprietary investment strategy.
Sticking to our disciplined investment strategy ensures we maintain a consistent, balanced approach.
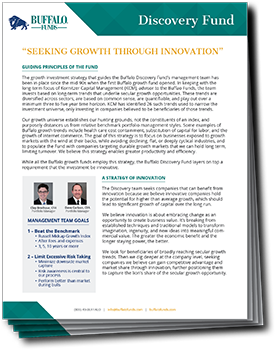
How the Buffalo Discovery Fund portfolio managers use innovation as the cornerstone of their investment strategy
Innovation is having an impact in every aspect of our lives, from healthcare to manufacturing to online services. We are even seeing innovation in something as mundane as trash collection. The trend towards innovation has been around for hundreds of years, but the accelerated pace of technological advances provides for an ever-increasing level of growth in innovative ideas.
The portfolio managers of the Buffalo Discovery Fund strive to capitalize on these trends by continuing to seek investment opportunities in premier growth companies, which are using innovation to disrupt the old ways of conducting business.
Our Portfolio Managers look for companies that:
In this latest report, we outline our views on innovation as a key component of our investment criteria for companies in the Buffalo Discovery Fund portfolio.
We get to know the companies we invest in and learn how they run their business.
We identify Top-Down broad, secular growth trends and search for companies from the Bottom-Up.
We construct our portfolios based on our own proprietary investment strategy.
Sticking to our disciplined investment strategy ensures we maintain a consistent, balanced approach.

Home > Insights & News > White Papers & Research > Industry Perspectives 2Q 2017
“From a market risk perspective, we remain concerned about the influence passive investments, such as ETFs and index funds, could have on stock prices in a volatile market.”
Clay Brethour, President, Buffalo Funds
Overview:
As we move into the 2nd half of 2017, we take a look at the global equity markets and the drivers of change that could move the markets in one direction or another. We also outline potential Central Bank and Federal Reserve policy changes that could affect the financial markets later this year.
From pending legislation in the U.S. to upcoming international elections, we give our outlook on the industry and how it might affect you in 2017.
We get to know the companies we invest in and learn how they run their business.
We identify Top-Down broad, secular growth trends and search for companies from the Bottom-Up.
We construct our portfolios based on our own proprietary investment strategy.
Sticking to our disciplined investment strategy ensures we maintain a consistent, balanced approach.
Stay up-to-date with the most recent media coverage and press releases about the Buffalo Funds.
Home > Insights & News > Fund Communications > BUFSX – A Small Cap Fund with Potential Positive Momentum
The page you requested could not be found. Try refining your search, or use the navigation above to locate the post.
The page you requested could not be found. Try refining your search, or use the navigation above to locate the post.
A Small Cap Fund With Potential Positive Momentum |
The Buffalo Small Cap Fund has a long history of investing in companies that can benefit from long-term trends while maintaining valuation discipline.
|
|
Long-Term Growth Strategy – The Fund seeks high-quality companies poised for sustainable growth with strong, competitive positions and reasonable valuations. Idea generation has been a key focus for the Fund over the past 2 years, which has broadened the portfolio, reduced single stock risk, and driven recent performance. We believe a greater domestic focus by most small cap companies aligns well with the focus of the new administration and makes small cap investing very timely. Top 5 BUFSX Portfolio Holdings*
|
||||||||||||||||||||||||||||||||||||||||||||||||||
|
|
Open for Business – it is often difficult to find a Small Cap Growth fund open to new investors due to the category’s limited capacity constraints. BUFSX was closed to new investors but is now OPEN… with significant capacity to grow assets. |
||||||||||||||||||||||||||||||||||||||||||||||||||
|
|
Performance Matters – the Buffalo Small Cap 1-year total return is beating the Russell 2000 Growth Index by 19%.
Performance data quoted represents past performance; past performance does not guarantee future results. The investment return and principal value of an investment will fluctuate so that an investor’s shares, when redeemed, may be worth more or less than their original cost. Current performance of the fund may be lower of higher than the performance quoted and standardized performance information can be obtained here. Performance is annualized for periods greater than 1 year. Each Morningstar category average represents a universe of funds with similar objectives. |
||||||||||||||||||||||||||||||||||||||||||||||||||
|
|
Battle Tested – the Fund was launched in April 1998 and has a 19-year track record, weathering all types of markets. |
||||||||||||||||||||||||||||||||||||||||||||||||||
|
|
Benefits of Active in Small Cap – we believe small cap stocks are often inefficiently-priced given they receive less attention from Wall Street firms. Because of this, we believe active management is the right choice for the small cap asset class over the long-term. We seek to generate superior long-term performance with a strategy that offers a broad, diversified portfolio, which may make it less volatile. |
||||||||||||||||||||||||||||||||||||||||||||||||||
|
|
Experienced Management – the Fund’s managers have an average of 25 years of professional investment experience. |
*As of 12/31/16. Percent of net assets: Nevro 2.46%, Dave & Buster’s 2.26%, CyberArk Software 2.25%, CoStar Group 2.24%, InterXion Holding 2.23%. Holdings are subject to change without notice and are not recommendations to buy or sell any securities.
Diversification does not assure a profit, nor does it protect against a loss in a declining market.
The Russell 2000 Growth Index is an unmanaged index that measures the performance of those Russell 2000 Index companies with higher price-to-book ratios and higher forecasted growth values. The Lipper Small Cap Growth Fund Index is an unmanaged, equally weighted performance index of the 30 largest qualifying mutual funds (based on net assets) in the Lipper Small-Cap classification. It is not possible to invest directly in an index.
Stay up-to-date with the most recent media coverage and press releases about the Buffalo Funds.